
Time Frame Pairs
Most new traders end up flipping through five or six timeframes before they place a trade. The 15 minute, the 5, the 2, the 1, then back up to the hourly because something looked off. By the time they get to the bottom, they’ve seen something bullish on one and something bearish on another, and they’re not entirely sure what they’re looking at any more.
That feeling, the one where the charts all start contradicting each other, isn’t a sign you’re missing information. It’s usually a sign you’re using too much.
Time Frame Pairs is how I avoid that.
What Time Frame Pairs actually means
The idea is simple. Pick two timeframes and use them for two distinct jobs.
The higher timeframe sets the context. It tells you what the market is doing in the broader sense, where structure sits, where the bias leans. You use it to answer the question “is this an environment I want to be long, short, or out of?”
The higher timeframe sets the context. The lower timeframe is for execution.
The lower timeframe is for execution. It’s where you spot the actual entry, place the stop, and manage the trade. It tells you “where, exactly, and at what price?”
That’s the pair. One for context, one for execution. You don’t introduce a third timeframe mid-decision. You don’t drop to a faster chart because the trade is uncomfortable. The pair is the pair.
Why the pairing matters more than the timeframes themselves
Driving works as a rough analogy. When you drive, you’re using two distances at once.
You’re looking far ahead. Where does the road bend? Where’s the next junction you need to turn off at? What does the shape of the journey look like, the key turns and roundabouts and motorway exits that get you where you’re going? That’s the strategic view. You don’t act on it minute by minute, but it tells you what you’re doing and why.
You’re also watching the few metres in front of the bonnet. Not drifting out of lane. Reacting to brake lights, to a cyclist pulling out, to a pothole. Reading the road signs and traffic lights as they arrive. That’s the immediate view. It’s what keeps you alive and on the road in the next ten seconds.
Both are happening at once, and neither replaces the other. Only watch the far view and you’ll plough into the car in front. Only watch the bonnet and you’ll miss your junction, or worse, find yourself in the wrong lane at the wrong moment.
Trading is the same. The higher timeframe is the far view. Where is structure heading, where are the key levels, what’s the shape of the move? The lower timeframe is the bonnet view. Where exactly is price now, what’s it doing in the next few candles, is the entry there or not?
A defined pair forces a hierarchy. The higher timeframe wins arguments. If the lower timeframe says one thing and the higher says another, the higher one’s call is the one that holds. You execute on the lower timeframe only when it aligns with the higher, not when it disagrees with it.
That hierarchy is what stops a trader chasing their own tail.
Time Frame Pairs
What the pair looks like in practice
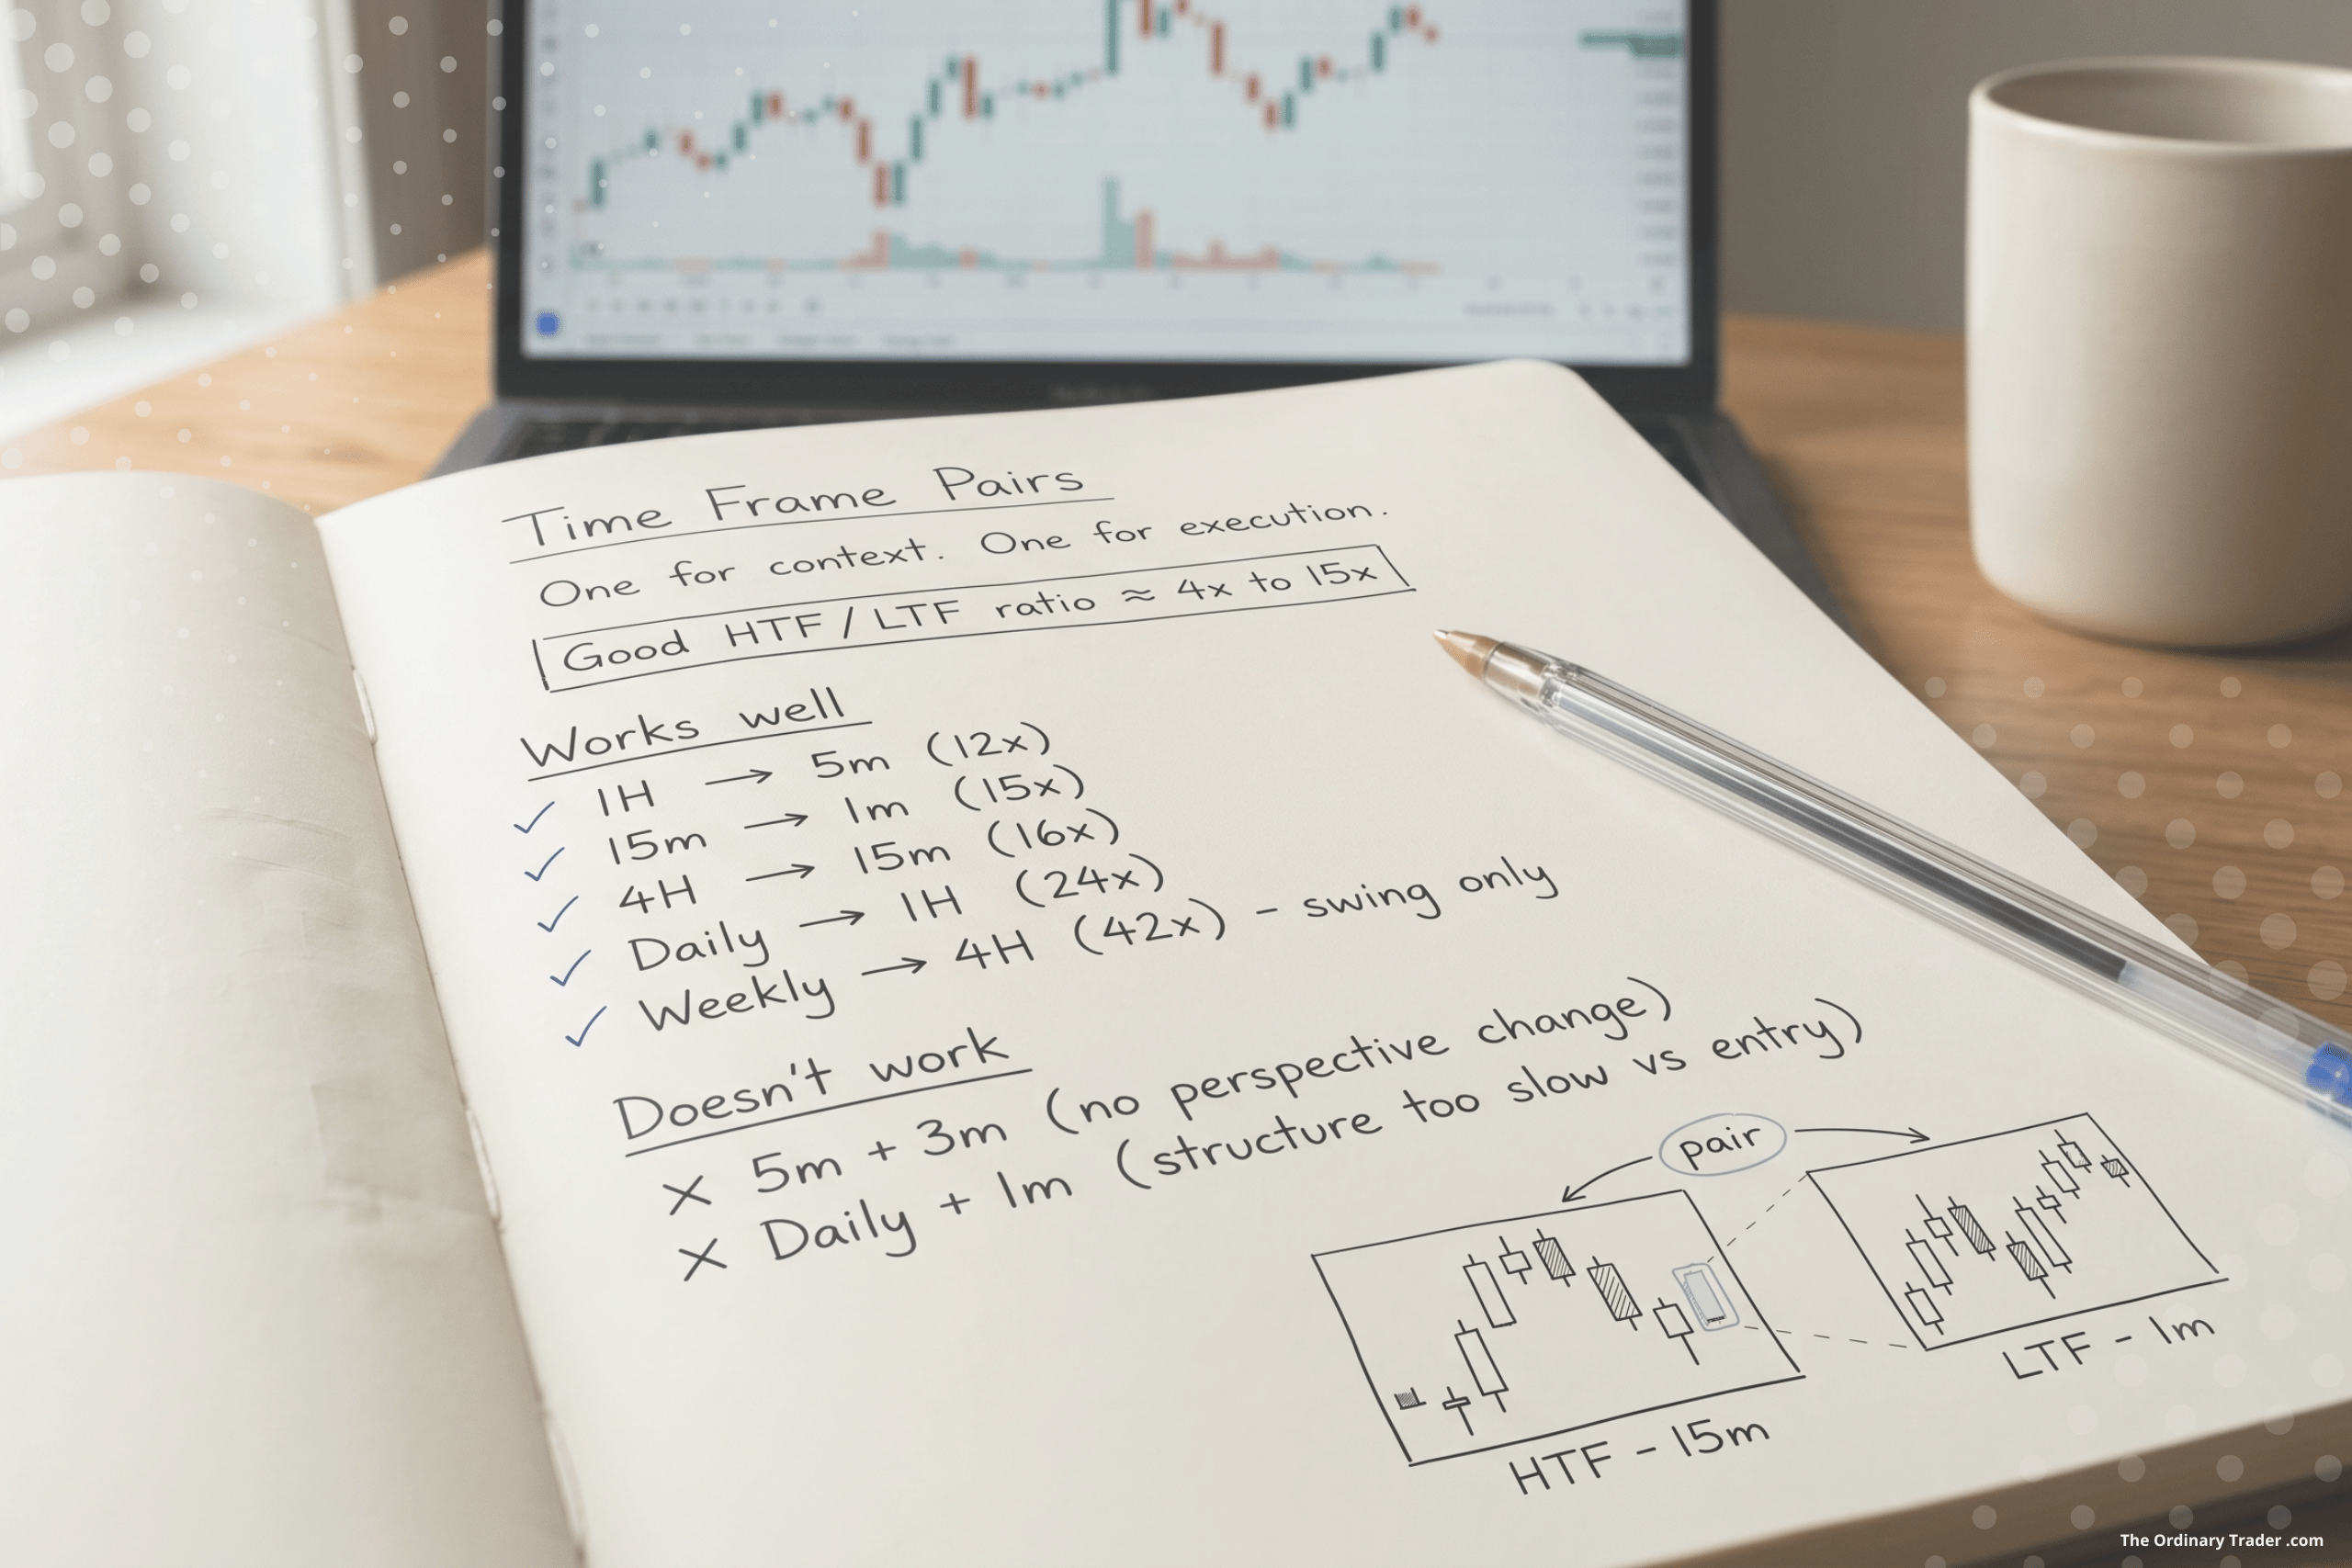
For The Strategy as I trade it, the pair is the 15 minute and the 1 minute. The 15 minute is where I read structure, mark zones, and decide whether I have a bias at all. The 1 minute is where I look for the entry, place the stop, and manage the trade once it’s live.
That’s the pair I use every session, and it’s the pair most users of The Strategy will settle on.
If you trade longer holding periods rather than intraday, the same principle applies, you just shift the pair up. A 1 hour and 5 minute pair, or a 4 hour and 15 minute pair, works the same way. The job each timeframe is doing doesn’t change. Only the speed of the clock does.
The rough rule is that the lower timeframe should sit somewhere between 12 and 16 times below the higher. The 15 and the 1 is 15x, which sits right in the middle. The 1 hour and 5 minute is 12x. The 4 hour and 15 minute is 16x. All three work. Pairs that fall outside that range tend to either move too similarly to give you two perspectives, or sit so far apart that the lower timeframe loses any sense of what the higher one is doing.
On TradingView, the cleanest setup is two charts of the same instrument side by side, one on each timeframe. Not five charts. Two.
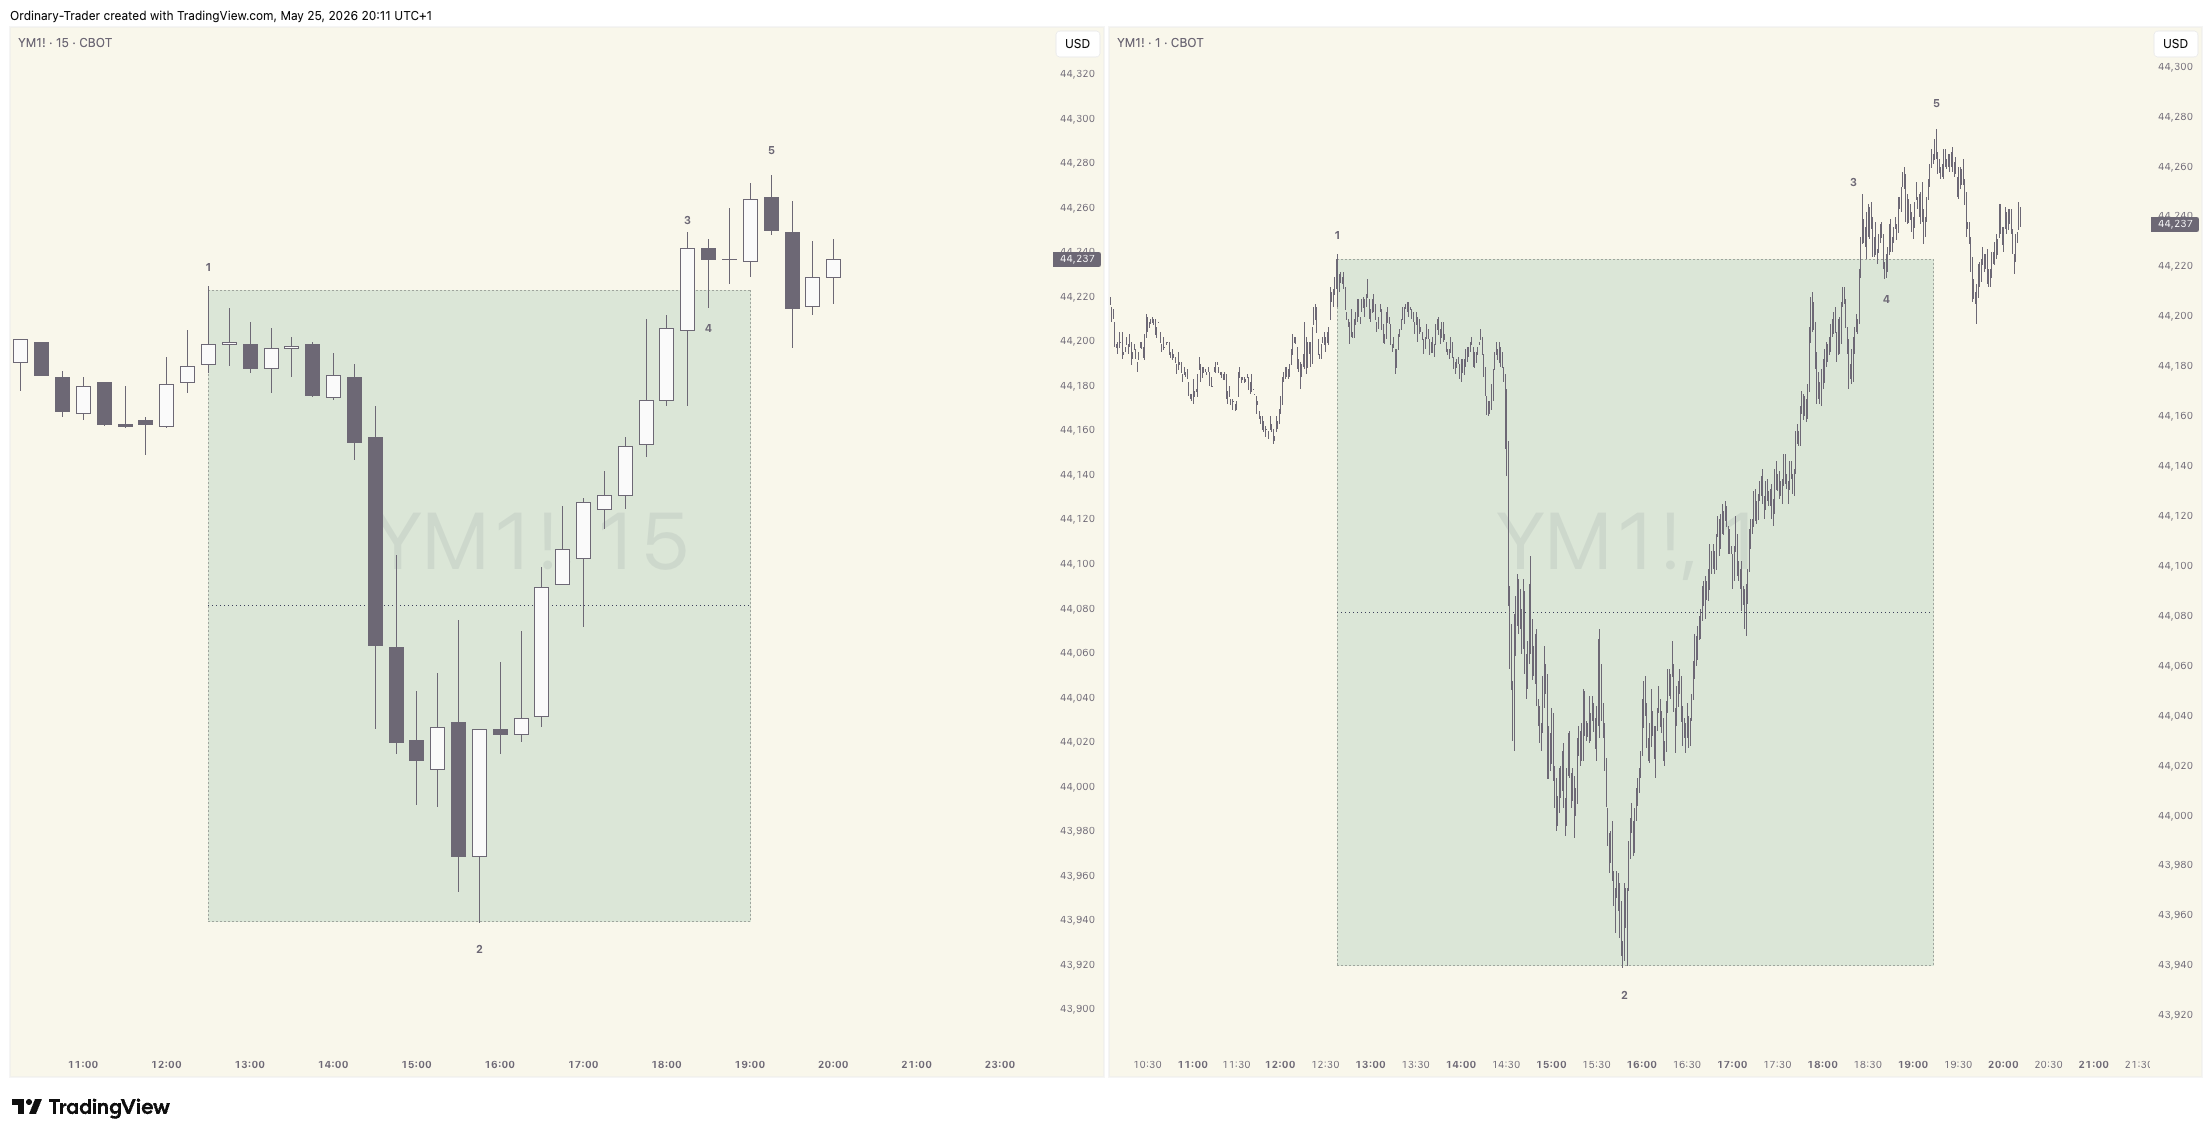
Time Frame Pairs Example Left M15, Right M1.
The common misreads
There are a few ways traders get this wrong, and most of them come from anxiety rather than analysis.
- Timeframe hopping mid-trade. You’re in a position based on the 1 minute setup. Price stalls. You drop to the 15 second chart to “see what’s happening.” Now you’re managing a trade on a timeframe that has nothing to do with how you entered it. The signal you act on at the bottom will almost always be too small to mean anything.
- Switching pairs day to day. Monday you traded the 15 and the 1. Tuesday you tried the 5 and the 1 because Monday felt slow. The point of the pair is consistency. If you change it every session, you’re not really using a pair, you’re using whatever feels right that morning.
- Letting the lower timeframe lead. The 1 minute looks bullish so you go long, ignoring that the 15 minute is mid-pullback inside a clear downtrend. The lower timeframe is for execution, not for picking a side. The side is the higher timeframe’s job.
- Pairing two timeframes that are too close. A 5 minute and a 1 minute is 5x. A 15 minute and a 5 minute is only 3x. Pairs like that don’t give you two perspectives, they just give you the same picture at slightly different zoom levels. The two charts should be doing visibly different jobs.
Where Time Frame Pairs sits in The Strategy
This is the first piece of The Playbook because nothing else works without it. Market Structure is read on the HTF. The Zone is identified on the HTF. Break of Structure, Liquidity Sweep, Points of Interest, the Fibonacci levels, The Flip, Path to Profit, all of those execution signals are looked for on LTF.
If the pair isn’t fixed, none of the rest can be applied consistently. Two traders using the same Strategy on the same chart will reach different conclusions if one is paired 15/1 and the other is flicking between six timeframes at random.
The pair is the frame everything else hangs on.
What comes next
Once your pair is fixed, the next job is reading the HTF properly. That means understanding Market Structure, the sequence of swing highs and lows that tells you whether the market is trending, ranging, or shifting from one to the other.
That’s the next piece.
Trade well. Stay ordinary.