Liquidity: where it sits, why price goes looking for it, and how to stop being it
You put the stop just above the swing high. Sensible place. Obvious place.
Price runs up, clips it by four ticks, then turns and goes exactly where you thought it would go. Without you.
It feels personal. It isn’t. But the real explanation is not much more comforting, because it means your stop was sitting in the most predictable spot on the chart.
Liquidity is resting orders. That is all it is.
Strip the word back and liquidity means orders waiting to be filled.
Every trade needs two sides. To sell, you need someone buying from you. Usually that is fine, because orders flow steadily around the current price. The problem starts with size.
Say someone wants to sell a large position. If only a thin scattering of buy orders sits nearby, each slice fills at a worse price than the last. They push the market against themselves before they are done. What they need is a concentration of buy orders in one place, deep enough to absorb the size.
A stop-loss on a short position is a buy order. It sits above the market, dormant, until price reaches it. Put a few thousand shorts together with stops just above the same swing high, and you have a pool of buy orders resting at one price, waiting to be triggered.
Nobody has looked up your account. This is how an auction works: large orders go where they can be filled, and stops gather in predictable places.
…your stop was sitting in the most predictable spot on the chart.
Where liquidity actually sits
You can mark most of it before the session starts.
- Above swing highs and below swing lows. A swing high is a peak with lower highs either side of it. Shorts protect themselves above it, and breakout traders buy above it.
- Above the prior day’s high and below the prior day’s low. Yesterday’s extremes are a reference point almost everyone shares.
- At session highs and lows. The London range and the first hour of the US session both leave edges behind.
- Around round numbers. $4,500 attracts more orders than $4,497, simply because people think in round numbers.
- Either side of a range that has held several times. Every touch that gets rejected adds another layer of orders just beyond the edge.
Equal highs and equal lows
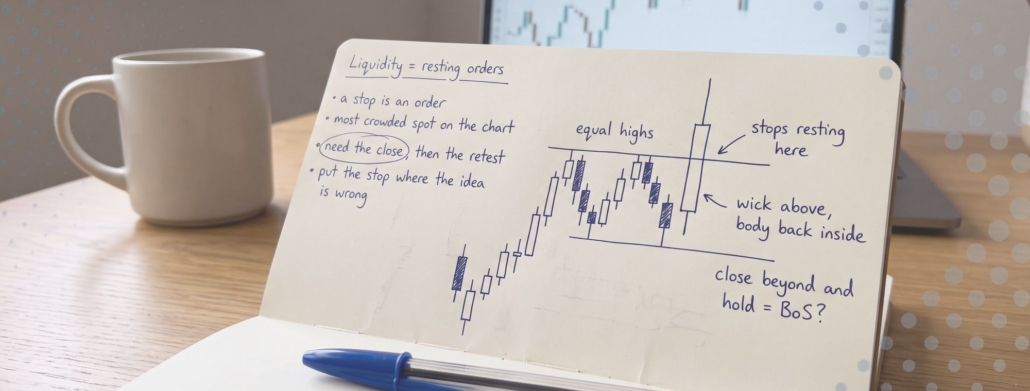
This is the clearest example. Two or more highs finishing at almost exactly the same price, so the chart shows a flat ceiling rather than a rounded one.
It reads as a level that is holding, so sellers work into it with stops just above. It also reads as a level about to break, so breakout buyers put buy stops just above. Two groups doing opposite things, leaving their orders at the same price.
That is a shelf of resting buy orders in plain sight. If you needed to sell size, you would go there too.
The Liquidity Sweep, read as an event
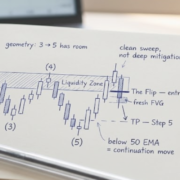
A Liquidity Sweep is a component of The Playbook, and the shape is consistent. Price pushes beyond the level, triggers the resting orders sitting there, fails to hold, and closes back inside.
The candle leaves a wick beyond the level and a body back inside it. The orders resting there have been filled, whoever needed them has their position, and price has no particular reason to stay up there.
A sweep and a real break look identical at the time
This is the part worth being honest about.
A genuine break differs from a sweep in one respect. Price closes beyond the level, then holds it on the retest. In The Strategy that is a Break of Structure (BoS): a close beyond a prior swing point saying the previous structure has given way. Price comes back to the level, treats it as support rather than resistance, and carries on.
A sweep goes beyond, closes back inside, and travels the other way.
The difference is not in the push. It is in what follows. At the moment price trades above the high, you cannot tell which one you are watching. Anyone who claims otherwise is describing hindsight.
So the reaction matters more than the push. Acceptance beyond a level, meaning price closes above it and holds it when it comes back, is one story. Rejection is another. You need the close, and usually the retest, before you know which.
How to stop being the liquidity
Four adjustments. None of them complicated.
Stop using the obvious price. One tick above the high is where everyone else is, and that is exactly what makes it worth reaching for.
Place the stop where your idea is actually wrong. If your short depends on price failing to accept above $4,520, then acceptance above $4,520 is your invalidation. Not a wick to $4,521. Give the level room to be swept and still be a level. If that stop is too wide for your risk, the position is too big. Size down, or leave it.
Treat a sweep as information, not a signal. It tells you orders have been filled and one side has been pushed out. It does not tell you where price goes next. A reason to pay attention, not a reason to click.
Consider waiting for the reclaim. Instead of catching the wick while it is still printing, wait for price to close back inside the level and hold. The entry is worse. In exchange you get confirmation that the sweep failed, which is what you were guessing about a minute earlier.
Put the stop where your idea is wrong rather than where the chart looks tidy, and you stop being part of the pool.
The uncomfortable part
Getting swept is not evidence that anyone was after you.
It is evidence that your stop was in the most crowded place on the chart, and that somebody needed exactly what your stop was offering.
That is a fixable problem. Not a flattering one, but fixable. Put the stop where your idea is wrong rather than where the chart looks tidy, and you stop being part of the pool.
You will still get stopped out. Just less often for that particular reason.
Trade well. Stay ordinary.