

It took me over a decade climbing the corporate ladder to reach a solid six-figure salary. It took six months of focused learning to trade to earn the same. That gap was hard to ignore and the contrast forced a decision.
I chose trading and went full-time. Not because it’s easy, not because of money, but because it’s more honest. It rewards skill, process, and consistency. It exposes your emotions, demands discipline, and provides instant and radical feedback in a way most careers will never do.
This is my own journey, my path to $1 million – and you’re welcome to follow along.
The money isn’t the point. The experiment is! The challenge is whether discipline and repetition can be turned from something that feels impossible into… the Ordinary.
Ambitious? Yes. Unachievable? Let’s see…
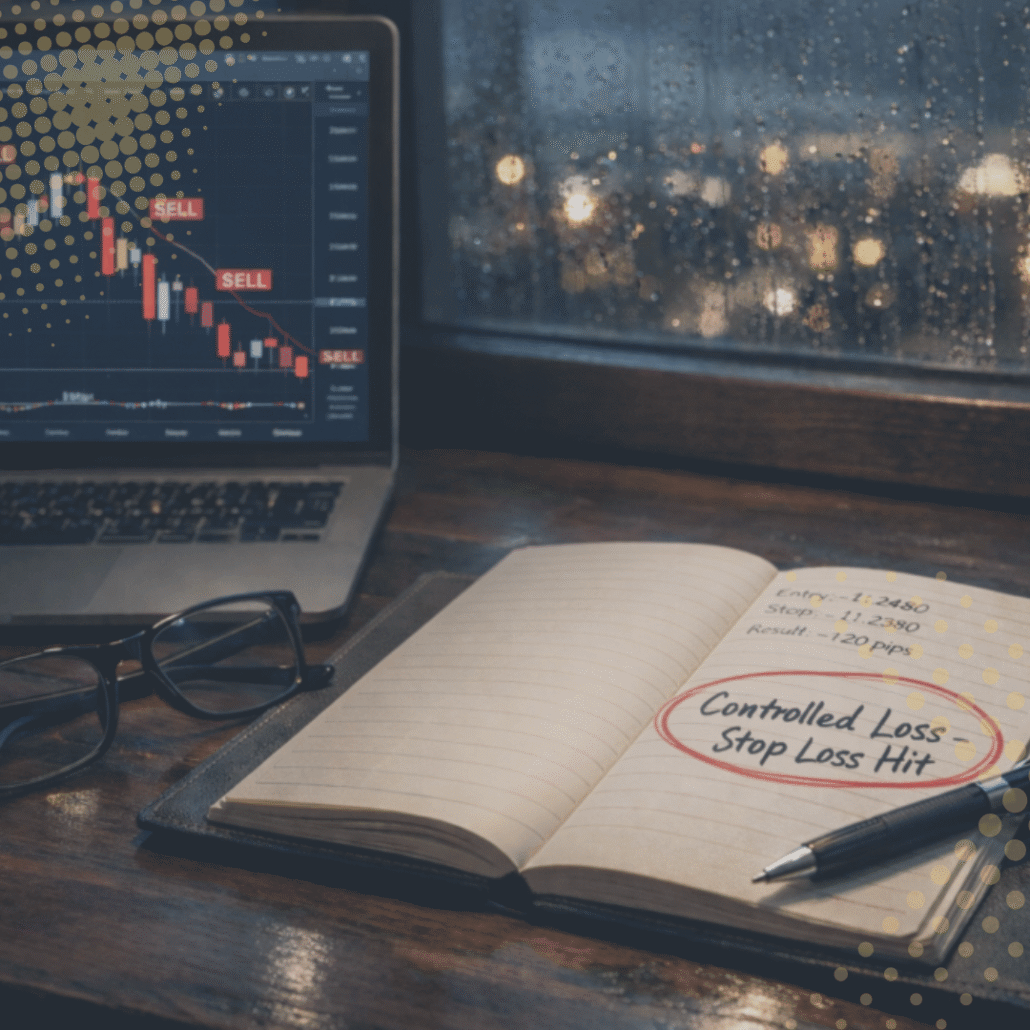
My trading approach is simple and disciplined. Every decision is rule-based, mechanical, and made without emotion. I focus on proven processes, clear risk-to-reward parameters, and well-defined trade plans before any position is taken. This helps to minimise losses, maximise asymmetric returns, and remain calm and consistent across changing market conditions.
I knew that to succeed in trading I needed a framework as well as a strategy – one that would keep me honest, remove emotion from decision-making, and make the process as mechanical as possible.
You can read more about it, (and download) my Daily Trading Planner, here…
Max Daily Loss Limit
(Of Total Capital)
Trades a day
(maximun)
Daily Profit Target


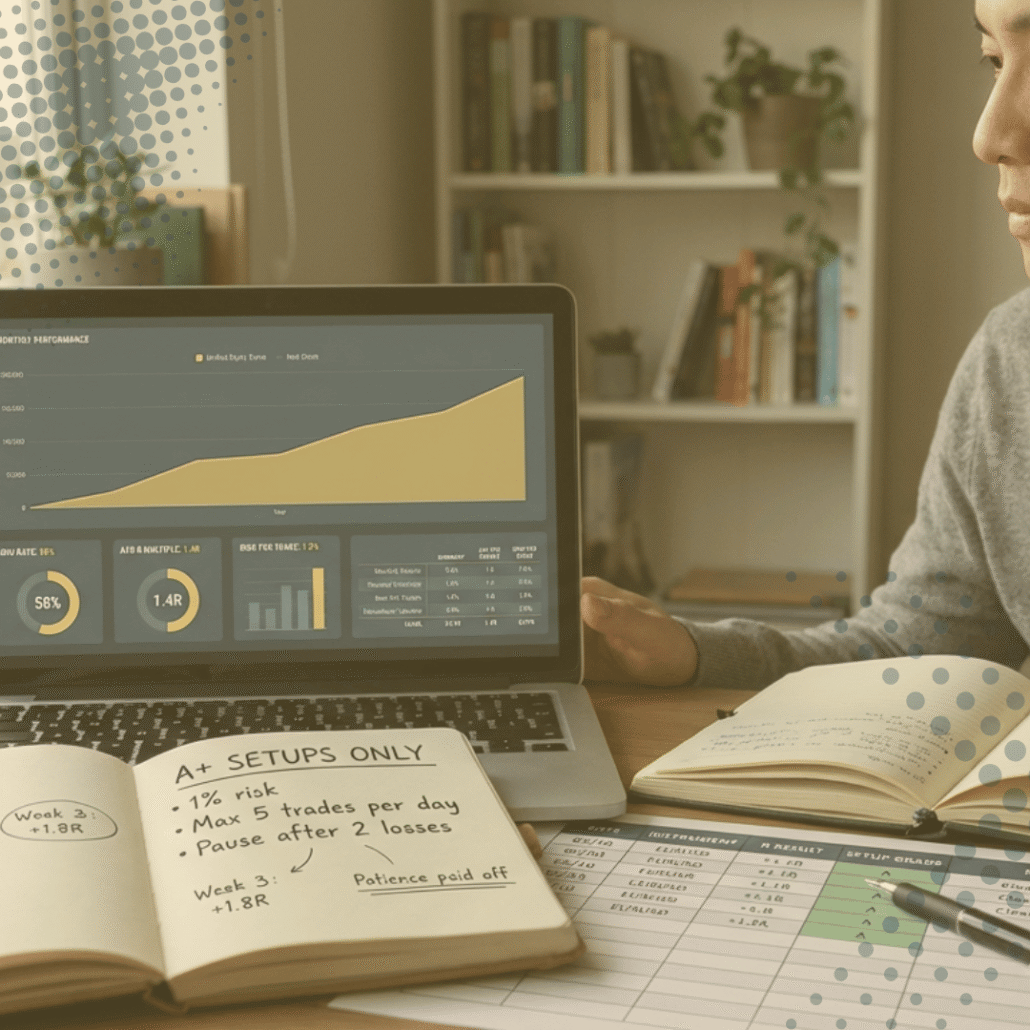
How can you optimise what you’re not measuring? You can’t. That’s why I track everything – every trade, every R, every mistake, and every improvement. It’s still early days, but performance since the start of the year has been encouraging. Win rate has remained consistent, risk-to-reward is improving, and the data is starting to show where edge exists and where it doesn’t. Because in trading, progress isn’t based on opinion or emotion – it’s built on evidence. Jump in to see a breakdown of the analytics setup I use to measure and refine the process here.
Avg Weekly
Risk Reward
Avg Weekly
Win Rate
Profit Factor
Guesswork
 https://www.theordinarytrader.com/wp-content/uploads/2026/07/hero-cant-hold-to-final-tp.jpg
760
2000
The Ordinary Trader
https://www.theordinarytrader.com/wp-content/uploads/2026/02/Ordinary-Logo-1.png
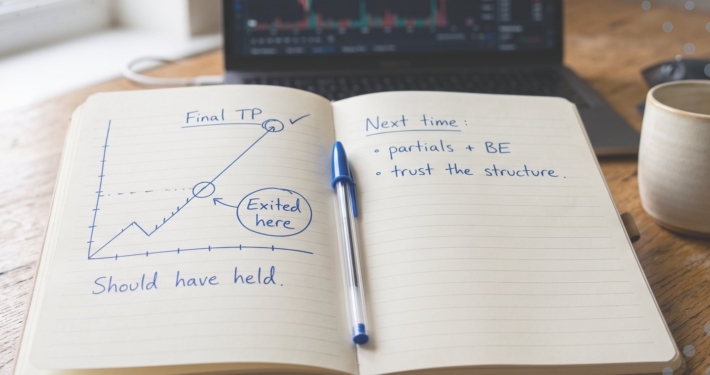
The Ordinary Trader2026-07-20 16:09:492026-07-20 16:09:49Why you can’t hold your position to the final TP
https://www.theordinarytrader.com/wp-content/uploads/2026/07/hero-cant-hold-to-final-tp.jpg
760
2000
The Ordinary Trader
https://www.theordinarytrader.com/wp-content/uploads/2026/02/Ordinary-Logo-1.png
The Ordinary Trader2026-07-20 16:09:492026-07-20 16:09:49Why you can’t hold your position to the final TP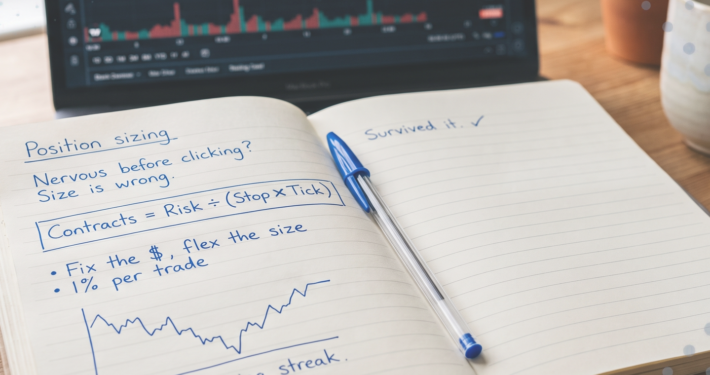 https://www.theordinarytrader.com/wp-content/uploads/2026/07/hero-position-sizing.png
760
2000
The Ordinary Trader
https://www.theordinarytrader.com/wp-content/uploads/2026/02/Ordinary-Logo-1.png
The Ordinary Trader2026-07-07 12:11:452026-07-07 12:11:45Your nerves are a position size indicator
https://www.theordinarytrader.com/wp-content/uploads/2026/07/hero-position-sizing.png
760
2000
The Ordinary Trader
https://www.theordinarytrader.com/wp-content/uploads/2026/02/Ordinary-Logo-1.png
The Ordinary Trader2026-07-07 12:11:452026-07-07 12:11:45Your nerves are a position size indicator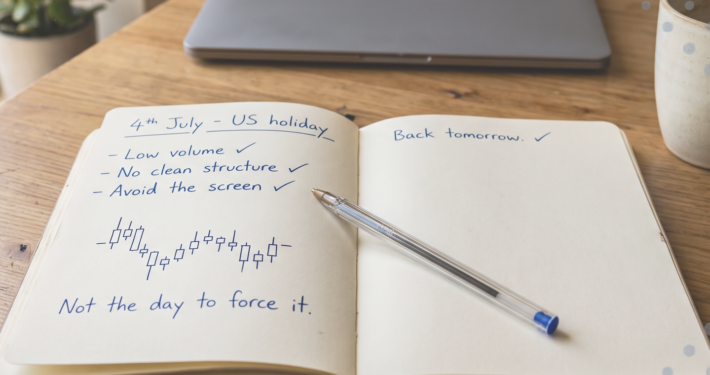 https://www.theordinarytrader.com/wp-content/uploads/2026/07/hero-trading-on-the-fourth-1.png
760
2000
The Ordinary Trader
https://www.theordinarytrader.com/wp-content/uploads/2026/02/Ordinary-Logo-1.png
The Ordinary Trader2026-07-03 10:01:132026-07-03 10:01:13Should you trade on the 4th of July?
https://www.theordinarytrader.com/wp-content/uploads/2026/07/hero-trading-on-the-fourth-1.png
760
2000
The Ordinary Trader
https://www.theordinarytrader.com/wp-content/uploads/2026/02/Ordinary-Logo-1.png
The Ordinary Trader2026-07-03 10:01:132026-07-03 10:01:13Should you trade on the 4th of July? https://www.theordinarytrader.com/wp-content/uploads/2026/06/hero-260604-big-win-wreck.png
760
2000
The Ordinary Trader
https://www.theordinarytrader.com/wp-content/uploads/2026/02/Ordinary-Logo-1.png
The Ordinary Trader2026-06-30 10:14:412026-06-30 10:14:41Why a big win can wreck you worse than a loss
https://www.theordinarytrader.com/wp-content/uploads/2026/06/hero-260604-big-win-wreck.png
760
2000
The Ordinary Trader
https://www.theordinarytrader.com/wp-content/uploads/2026/02/Ordinary-Logo-1.png
The Ordinary Trader2026-06-30 10:14:412026-06-30 10:14:41Why a big win can wreck you worse than a loss
Want every valid setup found, drawn and risk-calculated for you? The STRATEGY indicator automates the full Ordinary Trader method – when a setup forms, the entry, stop, target and risk-to-reward all appear on your chart. The trade is mapped before you decide whether to take it.
Want the prices that move markets always on your chart? The KEY LEVELS indicator plots previous day, week, month and year highs and lows, plus the times when Asia, London and New York traders are active – so you see exactly where price has reacted before and where liquidity is building right now.


Want every imbalance on the chart, scored and tracked for you? A Fair Value Gap is a price gap left behind when the market moves too fast in one direction – and price often returns to fill it. The FVGs indicator spots every one, ranks them by quality, and tracks what happens as price comes back.
Want to see higher-timeframe EMAs on a lower timeframe? The EMAs indicator lets you lock the 50, 100 and 300 on whatever timeframe sets your bias – daily, 4H, 15m – then drop down to find your entry. The trend stays visible the whole way.


Want supply and demand zones drawn for you, automatically? Supply and demand zones are the price ranges where buyers or sellers last stepped in with size – and price often reacts when it returns to them. The ZONES indicator maps both the big structural zones and the smaller intraday ones, so the areas that matter are always on your chart.
Want to never get blindsided by news-driven volatility? The NEWS indicator marks every high-impact news event on your chart – CPI, NFP, FOMC and the rest – so you can flatten positions, widen stops or stand aside before the candles start flying and your setup gets trashed.

Just to be clear, I’m not here because I’ve figured it all out. Far from it. I’m still learning just like everyone else. I make mistakes, I log them, and I move on. Perfection isn’t the goal here. Progress is. Small improvements, repeated daily, might look insignificant in the moment, but over time they compound into something meaningful. This is about showing up, staying honest, and getting 1% better – again and again.
