How to define an edge in a way you can actually measure
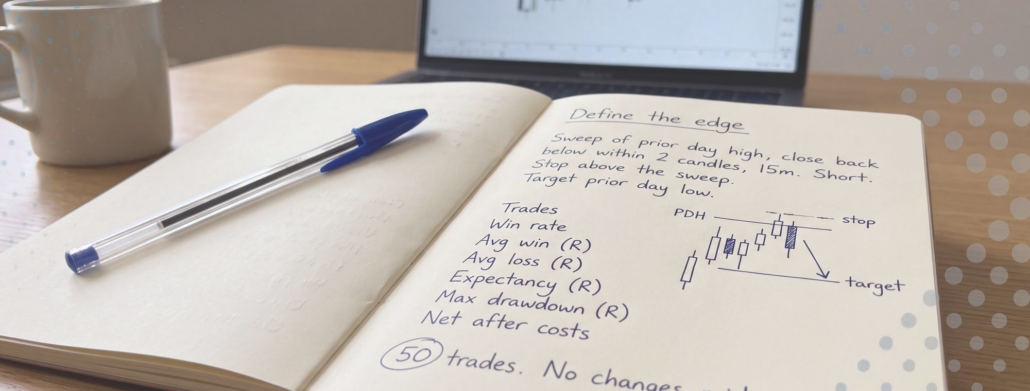
Ask a room of traders whether they have an edge and nearly every hand goes up. Ask them to write it down in one sentence, in a form another trader could follow, and most stop.
That gap is the problem. “Edge” is one of the most used and least defined words in trading. It gets used to mean confidence, or experience, or a feeling that things are going well lately. None of those can be measured. If you cannot measure it, you cannot tell whether you have one.
So start with a definition that does some work.
What an edge actually is
An edge is a repeatable set of conditions under which your outcomes, over a large enough sample, are better than random after costs.
Three parts. All of them matter.
Repeatable. You can specify the conditions in advance, in writing, and someone else could read them, apply them to the same chart and reach the same decision. If the conditions only become clear after the move has happened, they are not conditions. They are hindsight.
Over a sample. Not three trades. Not a good week. A run of outcomes large enough that luck starts to wash out. Any set of rules, however arbitrary, will produce a winning streak somewhere.
After costs. Commissions, exchange fees and slippage. On futures, costs are small per contract and constant per trade, which makes them easy to ignore and quietly fatal to small edges. A setup that makes 0.05R per trade before costs can make nothing at all after them.
Slippage is the difference between the price you expected and the price you got. It shows up most on stops and in fast markets.
Write it in a form that could be proved wrong
Here is the practical test. Can you write your edge as a statement specific enough to be tested?
“I trade market structure” is not testable. Neither is “I buy at Points of Interest when the context lines up.” They describe an approach, not a rule. Two traders could read them and take entirely different trades.
This is testable:
When price sweeps the prior day high and closes back below it within two candles on the 15 minute chart, I short with a stop above the sweep high and a target at the prior day low.
You may disagree with that rule. The point is that you could hand it to another trader, they could apply it to the last six months of charts, and you would both agree on which trades qualified.
The specificity is the point. A statement that vague cannot be proved wrong, which means it also cannot be proved right. And a belief that cannot be tested is not an edge. It is a preference.
Preferences are not worthless. Plenty of good traders start with one. But a preference that has never been counted is a hypothesis you have been paying to hold.
How many trades before you know anything
Honestly: more than you want.
Thirty trades tells you close to nothing. A 60% win rate over thirty trades is well within what a coin flip produces by chance. One hundred starts to be suggestive. Even then, a positive result may be luck, particularly if the whole record rests on two or three outsized trades.
That is uncomfortable, and worth sitting with. If you take two trades a day, one hundred trades is about ten weeks. That is the timescale on which the question gets answered. Not this week.
The numbers worth recording
For each testable statement, record these:
- Number of trades taken
- Win rate
- Average win in R
- Average loss in R
- Expectancy per trade in R
- Largest drawdown in R
- Net result after costs
R is your risk on the trade, expressed as one unit. If you risk $200 and make $400, that is +2R. Using R rather than dollars means the record still means something when your position size changes.
Expectancy is the number that matters most. It is the average result per trade in R: multiply your win rate by your average win, then subtract your loss rate multiplied by your average loss. A method that wins 40% of the time with an average win of +2R and an average loss of -1R has an expectancy of +0.2R per trade. Modest, and enough.
Expectancy survives account size changes. Net dollars do not. A trader who doubles size after a good month can post a bigger P&L while the edge underneath quietly gets worse.
Two ways traders break their own test
The first is curve-fitting. You look at the trades that lost, add a condition that would have excluded them, and repeat until the statement describes your past trades almost perfectly. What you have built is not a rule. It is a description of history. If a rule carries more than about four conditions, ask which ones you added after seeing the results.
The second is quieter and more common. You take fifteen trades, hit a losing run, decide the rule needs adjusting, and start again. Do that a few times and the sample never accumulates. You have been trading for two years and you still have no record of anything. Not because you were undisciplined, but because you kept restarting the clock.
Both come from the same place: wanting the answer to be yes.
What to do this week
Write one statement. Entry condition, stop placement, target, timeframe, and the market you will trade it in. Read it back and ask whether another trader could apply it without ringing you.
Then take that trade, and only that trade, for the next fifty occurrences. Log the seven numbers. Do not adjust the rule mid-sample. If you find a genuine flaw, note it, finish the sample anyway, and test the revision as a separate statement.
At the end you will have one of three answers. It works. It does not. Or the sample is too small to say and you need another fifty.
That third answer is the one most traders skip past, and it is a real result. Not knowing yet, with a record building underneath you, is a better position than being certain with nothing written down.
Trade well. Stay ordinary.