If you feel nervous before you click the button, your position is too big.

That’s not a mindset issue. It’s not something to breathe through or journal away. It’s information. The knot in your stomach is your own risk management telling you that you’ve put more on the line than you can calmly afford to lose. Listen to it.

If you couldn’t accept losing it beforehand, you were never sizing for the trade in front of you. You were sizing for the win you were hoping for.

Most new traders get this backwards. They think the goal is to feel nothing, so they try to suppress the nerves and take the trade anyway. Then they move their stop, or bail at the first wobble, or double down to get even. All of it traced back to one root cause: the size was wrong before the trade ever started.

Position sizing is the quietest topic in trading and the one that decides whether you’re still here in a year. So let’s actually talk about how to get it right.

Accept the loss before you enter

Here’s the test I run before any trade. Can I accept that this money is already gone?

Not “will this trade work.” That’s not up to me. What’s up to me is whether I’ve risked an amount I can lose without it changing anything. If the answer is no – if losing it would sting, or change how I feel about the day, or make me want it back – the position is too large. Full stop.

You have to make peace with the loss before you enter, not after. Once the trade is live, the money is at risk and the outcome is out of your hands. If you couldn’t accept losing it beforehand, you were never sizing for the trade in front of you. You were sizing for the win you were hoping for.

…make peace with the loss before you enter, not after.

Could this trade blow your account?

If a single trade can do real damage to your account, you’re too big.

The whole game is built on the fact that you will lose, often, and in clusters. A good strategy might win 50% of the time, which means strings of losers are not a bug, they’re a given. Four, five, six in a row will happen. If your size can’t absorb that, the strategy never gets the chance to work, because you’re out before the maths turns in your favour.

So the real question isn’t “what if this loses.” It’s “can I lose this eight times in a row and still be fine?” If sizing so that a normal losing streak is survivable feels too small, that feeling is the problem, not the size.

Flex the contracts, fix the dollar risk

This is the piece that ties it all together, and it’s where most people have it inverted. They keep the number of contracts the same and let their risk float around. It should be the other way round.

The dollar amount you risk stays consistent. The number of contracts flexes to keep it there.

Say I risk $500 a trade. On one setup my stop is 20 points away on MNQ, so I take a smaller number of contracts. On the next, my stop is only 12 points away, so I can take more and still risk the same $500. Same risk, different size. What changed is the stop distance, and the contracts moved to absorb it.

The formula is worth committing to memory:

Contracts = dollar risk ÷ (stop distance in ticks × tick value)

Work out where your stop belongs first, based on the chart and not on the size you want. Then let the formula tell you how many contracts that allows. The stop defines the trade. The contracts are just the dial you turn to keep your risk flat. Never widen a stop to justify a size, and never size up because a setup “feels” good.

Risk a percentage, not a fixed number

A fixed dollar figure is a fine place to start. A percentage is where it should end up.

Risking a consistent slice of your account – usually 1% to 2% per trade – does something a fixed number can’t. It scales down automatically when you’re losing and up as you grow. Lose a few and your 1% is now a smaller dollar figure, so you’re naturally risking less while you’re cold. It’s a built-in brake, and it means a bad run bends your equity curve instead of breaking it.

Watch out for hidden size

Two things quietly make you bigger than you think.

The first is correlation. A position in MNQ and a position in MES aren’t two small trades, they’re one large bet on the same market moving the same way. If both go against you at once, and they will, your real risk is the sum, not the pieces. Size them as the single position they actually are.

The second matters if you trade a prop account. Trailing drawdowns and daily loss limits mean it isn’t only your capital that ends the game, it’s someone else’s rule. When a fixed line can close your account, sizing so you never approach it stops being cautious and starts being the only way to keep the account at all.

The point of all this

Get sizing right and most of the “psychology” noise goes quiet on its own. You stop moving stops because there’s nothing to panic about. You stop revenge trading because no single loss was big enough to need revenge. You sit through the trade calmly, because you already accepted the worst case before you entered.

Get sizing right and most of the “psychology” noise goes quiet on its own.

Position size is the master lever. Not your entry, not your indicator, not your win rate. Size decides whether you survive long enough for the rest of it to matter.

You open the economic calendar (usually forexfactory) before the session, scan for red folders, and find nothing. No CPI. No jobs report. No central bank speakers. The day looks clear.

Most traders read that as a green light. A safe day. Nothing to blow up the chart, nothing to catch them off guard.

It’s not that simple.

A day with no scheduled news behaves differently from a day with a report on it, and those differences are easy to miss until they’ve cost you.

What “safer” actually means

There’s a real kernel of truth in the safety idea. High-impact releases like CPI or non-farm payrolls can move the futures market hard and fast. On the S&P (ES) you can see 20 to 80 points in the first few minutes of a release. On the Nasdaq (NQ) it can be 100 to 400. When the number hits, price can move so fast that your stop doesn’t just get triggered, it fills at a worse price than you set, because there’s nobody there to fill you where you wanted.

Take the scheduled release away and that specific risk drops. No data drop means a much lower chance of a sudden spike that runs your stop before you can think. In that narrow sense, a no news day is safer.

But safer from a spike is not the same as easier to trade. Those are two different questions, and people collapse them into one all the time.

No news doesn’t mean clean charts

Here’s the part that catches people out. A news release isn’t only a risk. It’s also fuel.

Big releases bring participation. They give the market a reason to pick a direction and commit to it. Some of the cleanest trending days of the month are built on a catalyst, with price opening near one end of the range and closing near the other.

Strip the catalyst out and you often strip out the conviction with it. With fewer participants and thinner liquidity, price has less to push against. Moves start and stall. Every small push looks like the start of a trend and then fades. Stops get hunted in both directions because there isn’t enough order flow to hold a move together.

A news release isn’t only a risk. It’s also fuel.

That’s not a guarantee. A no news day that inherits a clear story from the session before, a strong close or a level everyone is watching, can still trend nicely. So it isn’t the absence of news that decides the day, it’s the absence of a story. An empty calendar just removes one of the most common reasons a market trends cleanly, which tilts the quiet day towards rotation and chop.

And most days are chop anyway. Markets spend far more time ranging and digesting than they do trending. A no news day just tilts the odds further in that direction.

Easy or hard depends on you, not the day

So is a quiet day easy or difficult? Honestly, that’s the wrong question.

A range-bound, low-conviction session is difficult if you trade it like a trend day. You chase the breakout, it fails, you flip, that fails too, and you’ve taken three trades in a market that was never going anywhere. That’s how a slow day quietly does more damage than a fast one.

The same day can be straightforward if you match your approach to it. Fewer trades. Tighter, more realistic targets. Patience for the spots where structure is actually clear, and a willingness to sit on your hands everywhere else. The market hasn’t changed its difficulty. You’ve changed whether you’re fighting it.

The calendar is the first thing I look at before a session, and this is where journaling earns its place. If you look back and see that your worst results cluster on quiet, newsless days, that’s not bad luck. That’s a mismatch between the conditions and how you traded them.

The quiet day before CPI is the one to watch

There’s one no news day that deserves special attention, and it’s the calmest-looking one of all. The day directly before a major release like CPI or an FOMC decision.

On paper, the calendar that day is empty. In practice, the market is already bracing for tomorrow.

Ahead of a big print, the professional desks do the opposite of what you’d expect. They take risk off rather than add it, because a surprise is a wild card they can’t control. On FOMC days the build-up has been clocked at 20% to 35% below average volume, with the daily range squeezing to a third or a half of a normal session. Liquidity thins out. The book gets shallow.

The result is a coil. Price grinds sideways in a tightening range while everyone waits. To an impatient trader it looks like a free, easy market. It is anything but. Thin conditions mean false breakouts fire constantly, and the liquidity that builds up sits at the obvious highs and lows of the range, right where stops cluster. It’s not unusual for price to sweep one side, then the other, clearing those stops before the real move ever arrives on the news.

Price grinds sideways in a tightening range while everyone waits.

So the day before CPI is a compression spring dressed up as a quiet afternoon. The mistake isn’t trading it. The mistake is trading it as though tomorrow isn’t coming, or worse, carrying a position into the print itself and hoping.

So, are no news days good for trading?

They’re not good or bad. They’re a different kind of day, and the job is to read which kind you’re in before you decide how to trade it, or whether to trade it at all.

The calendar isn’t a green light or a red one. It’s the first line of your plan. It tells you what kind of session to expect, so you can size and pace yourself to match. Read it that way, and a no news day stops being a trap and becomes just another set of conditions to trade well, or to leave alone.

You close the platform, glance at the day’s P&L, and it’s red. Not a blow-up day, just red. The annoying part is you didn’t trade badly. You actually had more wins than losses. You followed the plan. On paper it was a good day.  So what gives?

So why did your account go backwards?

I’ve had days exactly like that. The trades were fine. The sizing wasn’t.

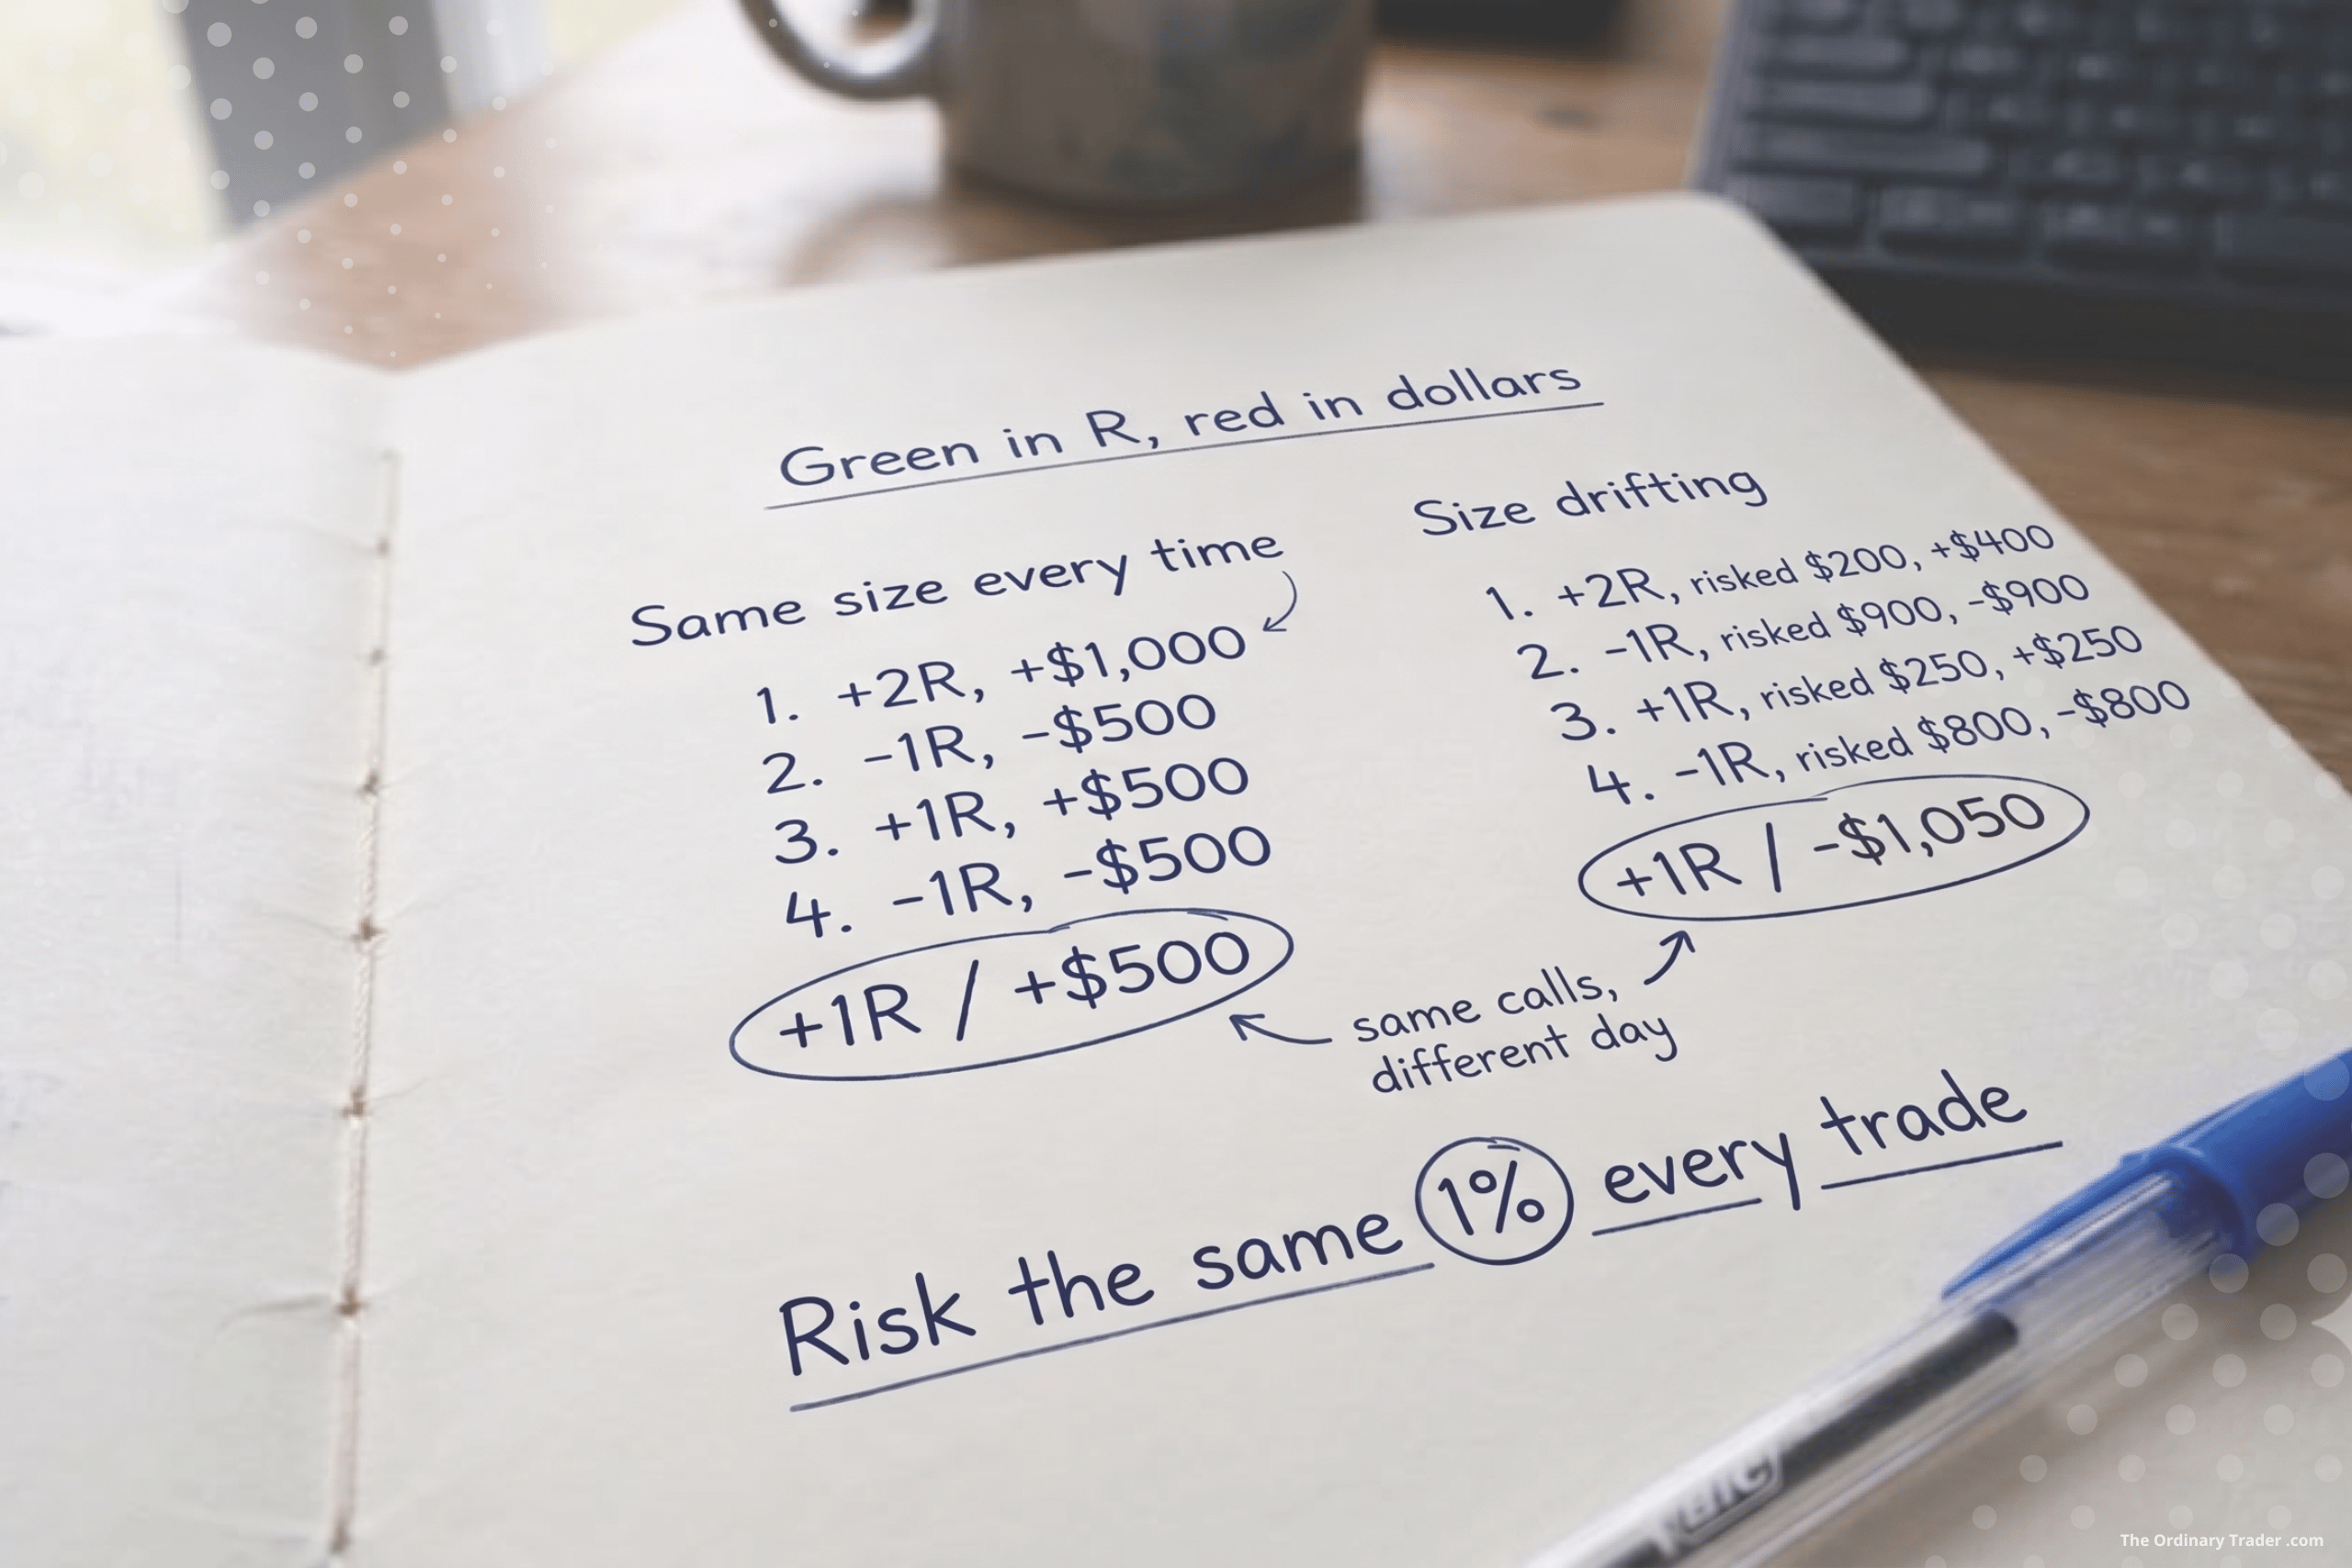
This is the gap between a green day in R and a red day in dollars. It catches a lot of traders out, and once you’ve seen it you can’t unsee it.

R measures your decisions. Dollars measure your consistency. You can read the market well all day and still finish red if your sizing is all over the place.

Thinking in R, not just dollars

Quick definition first. R is just the amount you risk on a single trade. Risk $500 on a position and that $500 is your 1R. A trade that pays twice your risk is +2R. A full loss is -1R. R lets you talk about trades without the account size getting in the way, so a +2R win is a +2R win whether you’re trading $5,000 or $500,000.

Counting your day in R tells you one thing: whether your decisions were any good. Add up the R across every trade, and a positive number means the market paid you for the calls you made.

Dollars tell you something else. They tell you whether your sizing matched those decisions.

Most days the two agree. A green day in R is a green day in dollars. But they only stay in step if every R is worth about the same number of dollars. The moment your sizing drifts, they come apart.

Same trades, two different days

Here’s a simple example. Account of $50,000, risking 1% per trade, so 1R is $500. Four trades on the day.

Sized the same every time, at $500:

  • Trade 1: win, +2R, +$1,000
  • Trade 2: loss, -1R, -$500
  • Trade 3: win, +1R, +$500
  • Trade 4: loss, -1R, -$500

Net R: +1R. Net dollars: +$500. Green in both. Nothing clever happened. The sizing was just consistent.

Now the same four trades, the same R outcomes, but the sizing wandered. The wins landed on setups I was unsure about, so I went in small. The losses landed on the ones that looked obvious, so I went in heavy.

  • Trade 1: win, +2R, risked $200, +$400
  • Trade 2: loss, -1R, risked $900, -$900
  • Trade 3: win, +1R, risked $250, +$250
  • Trade 4: loss, -1R, risked $800, -$800

Net R: still +1R. The decisions were identical. Net dollars: -$1,050.

Red.

Same trades. Same calls. One day green, one day red. The only thing that changed was how much sat on the line each time.

Why sizing drifts without you noticing

That second day isn’t a freak event. It’s the pattern most of us fall into the moment we stop sizing by rule.

The setups that feel obvious tempt you to size up. They look like free money, so why not press? The trouble is the market doesn’t know which of your trades felt obvious. Some of those sure things lose, and now your biggest position is also your biggest loss.

The setups you’re unsure about tempt you to size down. Then it runs clean to target and you’ve collected a fraction of what the call was worth.

Yesterday leaks in too. After a win, confidence is up and the next position quietly creeps larger. I had this on a crude oil trade not long ago. An early win in the session made it far too easy to assume the next long would behave the same way. After a loss, the opposite happens and you shrink.

None of this is a decision you make on purpose. That’s what makes it dangerous. The R stays honest. The dollars quietly betray you.

Risk the same amount every time

The fix is boring, which is rather the point.

Risk the same percentage on every trade. I aim for 1% of my balance, every time, no matter how good the setup looks. The whole idea of an edge is that you’re right more often than you’re wrong across a large number of trades. You don’t know in advance which individual trade will be the winner. So betting more on the ones that feel good is just guessing, dressed up as conviction.

Fix the percentage and the dollars line up with the R. A green day in R becomes a green day in dollars, because that’s how the maths works when every R is the same size.

When one contract is too much

There’s a practical snag. Futures contracts come in fixed sizes, and sometimes one contract already risks more than 1%.

Take crude oil. One standard contract (CL) moves $10 a tick. The micro version (MCL) is a tenth of that, $1 a tick. Say your stop is 20 ticks and your 1% is $500.

With the standard contract, one CL risks $200 over that stop. To hit $500 you’d need 2.5 contracts, and you can’t trade half a contract. So you round to two ($400, or 0.8%) or three ($600, or 1.2%). Either way you’ve missed your number.

With micros, one MCL risks $20 over the same stop. $500 divided by $20 is exactly 25 micros. You land on 1% precisely.

That’s the case for dropping down to micros. Not because they’re safer, but because they let you size accurately when the bigger contract is too blunt an instrument. Most index futures work the same way, with a full contract and a micro at a tenth of the size.

Let the journal catch it

You log every session anyway. Add one column. Track the R and the dollars side by side, day by day.

Most days they’ll agree. The day you want to notice is the one where the R is green and the dollars are red. One of those is noise. A run of them is a message, and the message is that your sizing is the leak, not your strategy.

That matters because the instinct when the account bleeds is to go hunting for a better setup. But if the R is positive, the setups are doing their job. The thing to audit is how much you put on each one.

A note for funded traders

If you’re trading a prop firm evaluation, this stops being just an annoyance. A lot of firms run consistency rules, a cap on how much any single day or trade can contribute to your total profit. Size all over the place and one oversized winner can breach that limit, failing the challenge even on a profitable run. Same fix as always. Risk the same amount every time.

The quiet discipline

R measures your decisions. Dollars measure your consistency. You can read the market well all day and still finish red if your sizing is all over the place.

Sizing isn’t the exciting part of trading. It’s not a setup or an entry. It’s the bit that runs underneath, deciding whether your good decisions actually show up in the account. Get it consistent and the green days in R start turning into green days in dollars, which is the only place the difference ever really shows.

You take a trade. It works. The screen shows +$600 gross. You close, feel good about it, log it in the journal, and move on.

Except you didn’t make $600.

You made closer to $525. The other $75 went to commissions, exchange fees, and clearing costs. Not in some hidden, suspicious way. They were always going to be there. But if you’ve never sat down and worked out what you actually pay per trade, that gap can be a quiet drag on expectancy that doesn’t show up until months later, when you wonder why the numbers don’t quite match what the chart said they should be.

The example below is specific to TradeStation US and MES (the Micro E-mini S&P 500), but the principle applies to any retail broker and any micro futures contract.

What the costs actually are

Three things come out of every futures trade, per contract, per side:

  1. Broker commission. TradeStation’s standard published rate is $1.50 per contract, per side. Entering 20 MES costs $30 in commission. Exiting costs another $30. That’s $60 round trip for commission alone.
  2. Exchange and clearing fees. The CME charges roughly $0.30 to $0.37 per micro contract, per side. On 20 contracts, that’s about another $7 each way.
  3. NFA regulatory fee. Two cents per contract, per side. Small on its own. Adds up at size.

Put it all together and a round trip on 20 MES costs around $75. On a $600 winner, that’s about 12.5% of your gross gone before you’ve done anything else.

The fixed cost trap

Here’s where micros get interesting. The per-contract cost is low, which is why they look cheap. But the cost scales with the number of contracts, not with the size of the move.

A 6-point winner on 20 MES is $600 gross, about $525 net.

A 2-point winner on 20 MES is $200 gross, about $125 net.

Same costs, different percentages. The smaller the win, the more it stings. And the costs don’t care whether you win or lose. A $600 loser is really a $675 loser once you factor in the round trip.

20 micros versus 2 minis

The standard E-mini (ES) is ten times the size of the MES. So 10 MES equals 1 ES in terms of exposure. 20 MES gives you exactly the same exposure as 2 ES: $100 per point on the S&P 500.

Same exposure. Same risk. Very different cost structure.

20 MES 2 ES
Point value $100 per point $100 per point
Commission (round trip) $60.00 $6.00
Exchange + clearing + NFA (round trip) ~$15.00 ~$8.20
Total round-trip cost ~$75.00 ~$14.20
Net on $600 gross winner ~$525.00 ~$585.80
Cost as % of gross ~12.5% ~2.4%

The exchange fees on ES are higher per contract (around $2 per side versus $0.35 for MES). But because you’re using far fewer contracts to get the same exposure, the total cost drops sharply.

That’s a $60 difference on a single trade. Run that over 100 trades a year and it’s $6,000 sitting in someone else’s account that could have been in yours.

When micros still earn their place

This isn’t an argument against micros. They serve a real purpose.

Micros are the right tool when:

  • You’re new and learning, and the risk per point on ES is too large for your account
  • You want finer position sizing, scaling in or out in small increments
  • You’re trading a strategy where the maths only works at sub-mini size
  • Your account is small enough that one mini is too much risk per trade

Where micros stop making sense is when your typical position size creeps past 6 to 8 contracts and stays there. At that point, you’re paying a real premium for granularity you may not need. The cost of being able to trade 7 contracts instead of 0 or 10 starts to outweigh the benefit.

micros stop making sense is when your typical position size creeps past 6 to 8 contracts and stays there

Run the numbers on your own trades

The point is not to switch to minis tomorrow. The point is to actually know what your costs are.

A simple exercise. Open your last twenty trades. For each one, work out:

  • Your gross profit or loss
  • Your total round-trip cost (commission, exchange, NFA)
  • The percentage of gross your costs represent

If the average is under 5%, you’re probably fine. If it’s pushing 10% or more, the cost structure is doing real damage to your expectancy. Worth a conversation with your broker about volume tiers, or a serious think about whether you’ve outgrown your current contract.

Most brokers, TradeStation included, will negotiate rates for active accounts. The rates aren’t fixed. They’re rarely advertised, and you have to ask.

The boring lesson

There’s no trick here. No secret cost the broker is hiding from you. Just the discipline of sitting down once, working out what each trade actually costs, then making sure that number stays small relative to your average R.

A 12% drag on every win and a 12% surcharge on every loss is the kind of thing that doesn’t feel like much in the moment but quietly compounds against you over a year. The maths is on the screen if you bother to do it.

Silver futures, just after 10am London time. The 1-minute chart had been grinding lower into the session. Bearish bias was there on the higher timeframes, and the indicator was painting a five-point sequence I’ve now seen play out enough times to know what to look for.

The trade ran 1.58R with effectively zero drawdown.

But the result isn’t the point. The setup is. Most sequences that print on the indicator are fine. They work often enough. The A+ ones look different, and once you’ve watched a few play out, you stop being willing to risk real money on the average ones.

Here’s what made this one A+, walking through it in roughly the order it printed.

The geometry has to make sense first

Before anything else, I’m looking at the distance between Step 3 and Step 5.

Step 3 is the swing low we want to see break out of the zone. Step 5 is the deeper swing low that completes the bearish structure, the furthest point from the zone before price heads back toward our liquidity at Step 4. A short distance between (3) and (5) means the pullback is shallow and the R:R gets compressed before you’ve even started.

This trade had room. Step 5 sat a meaningful distance below Step 3, which meant any pullback back up into Step 4 had to be substantial. A substantial pullback means a deeper entry, a tighter stop relative to the target, and a setup that’s worth taking risk on. If the geometry’s wrong, nothing else on the chart matters.

The depth of the Step 4 tap

The second filter is how price interacts with the Step 4 zone.

What I want to see is a clean sweep of (4) and an immediate rejection, not a deep mitigation well beyond (4). On this trade, price came back into the zone, wicked (4), and turned. That’s the indicator’s job, to observe, track and display these sequences as they play out, and it did it.

What made it A+ rather than just acceptable was what other confluences we could observe around that tap. The rejection came off a bearish fair value gap (FVG), an unfilled imbalance left by an earlier full-bodied bearish candle. So it wasn’t just price sweeping the liquidity at (4) and turning. It was price sweeping liquidity, hitting fresh bearish imbalance from a candle that had real intent behind it, and refusing to push through.

That’s not a coincidence. That’s sellers showing up exactly where you’d expect them to.

The Flip and what sits around it

The Flip is my entry trigger, the moment the indicator confirms a structural break in the direction of the original bias. On its own, it’s a signal. With the right context around it, it’s a different category of signal.

What I want to see around The Flip

Two things gave this one extra weight.

First, fresh bearish FVGs started forming right after The Flip. Multiple of them. That tells me the move down isn’t a one-candle reaction, it’s a sequence with momentum behind it. Each new FVG is an unfilled gap, and unfilled gaps are evidence that price is moving with intent rather than chopping.

Second, The Flip printed below both the 50 and 100 EMA. This one’s a hard filter for me in bearish setups, and I’ve built it directly into the indicator. If The Flip is above the 50 EMA, I’m probably looking at a counter-trend reversal, and counter-trend trades are a different beast. Below the 50 EMA, in an already bearish higher-timeframe context, means I’m taking continuation in the direction of the trend. The old adage holds up here, the trend is your friend, and on this setup everything was pointing the same way.

Execution becomes easy when the setup is right

Here’s the part I want to be honest about. When the setup is genuinely A+, execution stops being the hard part.

On this trade, I set my entry exactly on the flip line. There was zero drawdown. Not “almost zero,” literally none, because price had already committed to the move before The Flip printed, and the entry sat at the boundary of that commitment.

When price pushed close to 1R, I moved my stop to break even. That’s the rule, and it didn’t require any negotiation with myself. Target was Step 5, same as always.

After a minor pullback (the kind that always shows up and always feels worse than it is), price continued down. Two more fresh bearish FVGs formed on the way. TP hit cleanly.

The trade took care of itself, because everything that needed to be true at entry was already true.

A+ setups are filters, not formulas

The reason I keep using the phrase A+ instead of just “valid” is that the indicator will give you valid signals all day long. A large percentage of them will work. The job isn’t to take all of them.

The job is to wait for the ones where the geometry, the conditions of the sweep, the quality of the rejection, the freshness of the imbalance, and the EMA position all line up the same way.

You won’t get many of these every session, sometimes only 1 or 2 a week.

That’s fine. The discipline is in the waiting, not the trading.

Have you ever watched a clean breakout on NQ, felt that surge of confidence, clicked in… and then watched it snap back like it never meant it?

It happens. And when it does, it feels personal.

Here’s the thing. Sometimes the breakout isn’t wrong. It’s just lonely.

That’s where SMT comes in.

SMT, or Smart Money Technique divergence, is a concept popularised by Michael J. Huddleston. Strip away the branding and what you’re left with is simple: when two markets that usually move together stop agreeing, pay attention.

It’s not prediction. It’s not a crystal ball. It’s context.

And when you’re trading sweeps, displacement, and structure shifts on 15m and 1m, context is everything.

First, Why ES and NQ Even Matter Together

We’re talking about S&P 500 Index futures (ES) and NASDAQ-100 futures (NQ).

These two are close cousins. Different personalities, same family.

They move together because:

Same Macro Drivers

Both respond to:

  • Interest rates
  • Inflation data
  • Fed commentary
  • Risk on / risk off flows
  • US economic data

If the market is broadly buying equities, both rise.

If fear hits, both sell.

Simple.

Heavy Tech Overlap

Mega cap tech dominates both indices. When Apple, Microsoft, or Nvidia move, both ES and NQ feel it. Big money flows hit them at the same time.

So most of the time, they confirm each other.

Which is exactly why it matters when they don’t.

But They’re Not Identical, And That’s The Opportunity

Here’s where it gets interesting.

  • NQ moves faster
  • NQ respects structure differently
  • NQ overshoots more
  • ES is smoother

NQ is like the energetic sibling. Quick. Emotional. Aggressive. It runs highs and sweeps lows with conviction. ES is steadier. Broader. It grinds levels instead of exploding through them.

If you trade 15m for bias and 1m for entries, you’ve probably felt this already.

In practical terms:

  • ES tends to give cleaner higher timeframe structure
  • NQ tends to give sharper lower timeframe reactions
  • NQ rewards precision more but punishes size harder

A lot of traders use ES for bias and execute on NQ. Not because it’s clever. Because it makes sense. One gives clarity. The other gives movement.

And movement is where your edge lives.

So What Is SMT, Really?

SMT shows up at liquidity.

Equal highs. Equal lows. Session extremes. Obvious 15m levels where everyone can see the stops sitting.

Now imagine both ES and NQ approach equal highs.

One breaks.

The other doesn’t.

That’s SMT.

In a bearish scenario, one index makes a higher high while the other fails to confirm. Buy side liquidity gets swept in one market, but not the other. If the broader equity complex were genuinely strong, both should expand together.

When only one runs the stops, something feels off. That breakout might be distribution.

In a bullish scenario, one index sweeps sell side liquidity below prior lows, and the other refuses to break. That relative strength hints that the breakdown may be engineered.

It’s subtle. But it’s powerful.

SMT isn’t the entry. It’s the raised eyebrow before the move.

Bringing It Into A 15m / 1m Model

Let me explain how this fits into a structured approach.

On the 15m chart, you mark liquidity on both ES and NQ. Equal highs. Equal lows. Protected highs and lows. Clean swing points. That’s your map.

When price approaches those areas, you watch behaviour.

If one index sweeps liquidity and the other doesn’t confirm, you don’t jump in. You wait.

Then you drop to the 1m.

You look for:

  • Change of character
  • Displacement
  • Clear structure shift
  • Defined risk in premium or discount

Now your trade isn’t just a sweep. It’s a sweep plus divergence plus structure.

That’s different.

That’s layered probability.

How Do You Know Which Index Is Leading?

This is the part most traders skip.

If one index breaks and the other doesn’t, how do you know which one to trust?

Keep it simple.

Ask yourself:

  • Which index has been trending cleaner during the session?
  • Which index is showing stronger displacement?
  • Which index is respecting structure better?
  • Which index holds above a breakout level instead of instantly rejecting?

The stronger index tends to confirm real moves.

The weaker index tends to produce failed breaks and liquidity sweeps.

It’s not about who moved first.

It’s about who holds.

That distinction often decides whether you trade continuation or fade the move.

What SMT Is Not

SMT is not:

  • A standalone strategy
  • A guaranteed reversal signal
  • A reason to trade against trend blindly
  • A shortcut around confirmation

It is context layered onto structure.

Without structure, it’s just observation.

A Final Thought

Incorporating SMT into your strategy can feel like a glimpse into the future.

When a sweep occurs in one index and is rejected by the other, reversal probability increases. Not always. But often enough to matter.

That extra layer of context often turns average setups into A+ opportunities.

You’re still trading structure. You’re still managing risk. You’re still waiting for confirmation.

But now you’re asking a better question before you commit:

Is this move confirmed?

It is one of the most common questions in trading.

Should you trade the 1 minute?

The 15 minute?

The 4 hour?

The Daily?

The honest answer is simple.

Any timeframe works.

Market structure is fractal. A break of structure on the 1 minute behaves the same way as a break of structure on the 4 hour. Pullbacks, expansions, premium and discount all exist on every chart.

The difference is not validity.

It is speed.

Lower timeframes move faster.

Higher timeframes move slower.

But structurally, they follow the same logic.

So the real question is not which single timeframe is best.

The better question is which timeframe pairing makes sense.

Timeframes Work in Pairs

Trading from a single timeframe often creates blind spots.

You either have context with no precision, or precision with no context.

The solution is pairing.

One timeframe defines intent.

The other defines execution.

For example:

  • 15m defines structure and location
  • 1m confirms entries

Or:

  • 1H defines structure
  • 5m confirms entries

Or:

  • 4H defines structure
  • 15m confirms entries

The timeframe itself is not special.

The relationship between them is.

The 12 to 16x Rule

A practical guideline is to keep your timeframe separation in the 12 to 16x range.

Examples:

  • 1H to 5m equals 12x
  • 15m to 1m equals 15x
  • 4H to 15m equals 16x

This range creates a meaningful shift in perspective without disconnecting execution from intent.

If timeframes are too close, you are looking at almost the same structure twice.

If they are too far apart, the lower timeframe flips repeatedly while the higher timeframe barely moves.

The gap becomes unstable.

The 12 to 16x range keeps the structure aligned.

So What Is the Best Timeframe to Trade?

The best timeframe is the one that:

  • Matches your lifestyle
  • Matches your psychological tolerance
  • Matches your ability to focus
  • Can be paired properly with a higher timeframe

There is nothing magical about the 1 minute, the 15 minute, or the 4 hour.

They all work.

What matters is:

  • Clear role separation
  • Proper ratio
  • Structural consistency

Choose a pairing.

Define the roles.

Keep the ratio consistent.

The timeframe is not the edge.

Structure is.

Should You Take 1R or Let It Run?

Most new traders focus almost entirely on entries. They refine confirmations, tweak structure rules, and optimise timing. But very quickly you realise something more important. Your exit strategy determines your expectancy.

Let’s walk through a clean example using simple numbers. No complicated formulas. Just clear logic.

We will assume the same core distribution throughout so every strategy is compared fairly.

The Starting Distribution

Across a large sample of trades:

  • 40% lose and hit full stop at -1R
  • 30% reach 1R but fail to extend further
  • 30% extend beyond 1R and can reach 1.5R

This is the raw behaviour of your system before deciding how to exit.

Now let’s compare four exit strategies using this same base data.

Strategy 1: Fixed 1R Take Profit

In this model you close the entire position at 1R. No partials. No trailing. No runners.

Using the base distribution:

  • 60% of trades reach at least 1R
  • 40% lose -1R

So expectancy is:

  • 60% × +1R = +0.60R
  • 40% × -1R = -0.40R

Total = +0.20R per trade

This is clean and efficient. Your edge here is accuracy. You monetise the fact that most trades reach 1R.

Strategy 2: 50% Partial at 1R, Runner to 1.5R

This is the classic hybrid approach.

When price hits 1R:

  • Close 50% for +0.5R
  • Move stop to break even

If the trade extends to 1.5R:

  • Remaining half earns +0.75R
  • Total win = +1.25R

If price reverses after 1R:

  • Remaining half stops at break even
  • Total win = +0.5R

Using our distribution:

  • 30% hit 1.5R → +1.25R
  • 30% stall after 1R → +0.5R
  • 40% lose → -1R

Now calculate:

  • 30% × 1.25R = +0.375R
  • 30% × 0.5R = +0.15R
  • 40% × -1R = -0.40R

Total = +0.125R per trade

Still profitable. But lower than the simple 1R model.

Why? Because only 30% of trades meaningfully extend. The runner frequency is not high enough to compensate for halving position size.

Strategy 3: Full Position Runner to 1.5R

Now we remove partials. The entire position aims for 1.5R.

If price reaches 1R but fails to continue, you move stop to break even and make nothing.

Distribution becomes:

  • 30% hit 1.5R → +1.5R
  • 30% reach 1R but reverse → 0R
  • 40% lose → -1R

Expectancy:

  • 30% × 1.5R = +0.45R
  • 30% × 0R = 0
  • 40% × -1R = -0.40R

Total = +0.05R per trade

You increased reward size but reduced realised wins. That trade off reduced expectancy.

Strategy 4: Structure Based Trailing

Now we remove the artificial 1.5R cap. Instead of targeting a fixed multiple, you trail behind structure and allow the market to decide.

To keep assumptions realistic, let’s use this distribution:

  • 40% lose → -1R
  • 30% reach 1R and then stop at break even → 0R
  • 20% trend moderately → +1.5R
  • 10% become strong runners → +2.5R

Now calculate:

  • 20% × 1.5R = +0.30R
  • 10% × 2.5R = +0.25R
  • 30% × 0R = 0
  • 40% × -1R = -0.40R

Total = +0.15R per trade

This improves on partials and fixed 1.5R runners, but still does not beat the simple 1R model under these conditions.

Comparing All Four

Using consistent assumptions:

  • Fixed 1R → +0.20R
  • Partials + 1.5R cap → +0.125R
  • Full 1.5R runner → +0.05R
  • Structure trailing → +0.15R

Under this distribution, the simplest strategy wins.

What This Teaches a New Trader

Risk reward ratio alone means nothing. A 1:1.5 target is not automatically superior to 1:1. What matters is how often price actually extends.

Your optimal exit depends on the behaviour of your market.

In rotational conditions:

  • Moves stall quickly
  • Pullbacks are deep
  • Extensions are limited

That profile favours harvesting 1R consistently.

In strong trending conditions:

  • Pullbacks are shallow
  • Structure stair steps cleanly
  • Large extensions are common

That profile favours structure based trailing and uncapped runners.

The mistake is using the same exit logic in both environments.

How to Decide With Data

Track one simple metric over your next 50 trades:

Maximum favourable excursion measured in R.

If most trades rarely exceed 1.5R before reversing, fixed 1R exits are likely optimal.

If a meaningful percentage regularly reach 2R or more, you may be capping your distribution too early.

The goal is not to maximise reward on a single trade. The goal is to optimise your overall distribution.

Sometimes the ordinary 1R is the most efficient solution.

Sometimes the market is offering a trend and you need to step aside and let it pay you.

The numbers will tell you which environment you are in.

There is solid science behind the idea that your ability to make good decisions changes across the day. It is one of the most studied topics in psychology, behavioural economics, and neuroscience.

Put simply:

  • The brain has limited self-regulation resources
  • Using them repeatedly makes them temporarily weaker
  • Fatigue changes risk perception and impulse control

For traders, that is not abstract theory. That is revenge trading. That is FOMO. That is dropping your entry standard from A+ to “this will do.”

Let’s unpack it.

Ego Depletion and Decision Fatigue

Researchers like Roy Baumeister proposed that willpower and disciplined thinking draw from a finite mental resource.

Every act of:

  • Resisting impulse
  • Analysing uncertainty
  • Managing emotion
  • Waiting for confirmation
  • Passing on a mediocre setup

…uses some of that fuel.

As the day progresses, the tank runs lower. When depleted, people tend to:

  • Choose easier options
  • Avoid complex thinking
  • Act more emotionally
  • Seek immediate reward
  • Abandon previously agreed rules

Not because they want to. Because the brain is tired. In trading terms, that shift is subtle but dangerous.

An A+ setup becomes an A.

An A becomes a B+.

A B+ becomes “close enough.”

And “close enough” is where consistency dies.

System 1 vs System 2

In Thinking, Fast and Slow, psychologist Daniel Kahneman describes two modes of thinking:

System 1 → fast, automatic, emotional

System 2 → slow, effortful, logical

Trading well requires System 2.

Waiting. Calculating. Filtering. Ignoring noise.

But as mental energy drops, the brain defaults to System 1.

Which means later in the session you are more likely to:

  • Revenge trade after a loss
  • Close winners early out of fear
  • Oversize to “make it back”
  • Ignore missing confirmation
  • Rationalise weak entries

It feels justified in the moment.

It rarely is.

The Judge Study

One of the most famous demonstrations of decision fatigue looked at Israeli judges.

Researchers found:

  • Early in the day → more thoughtful, favourable rulings
  • Right before breaks → harsher, default decisions
  • After food and rest → decision quality improved again

Judgement changed based on mental fatigue.

Not morality. Not intelligence. Not experience.

Energy.

Now apply that to a trader four hours into screen time, three trades in, slightly red, watching price move without them.

The conditions are perfect for a poor decision.

What Happens Biologically?

As cognitive load builds:

  • Attention declines
  • Emotional regulation weakens
  • The prefrontal cortex (responsible for discipline and planning) becomes less effective
  • Impulse systems become louder

So discipline literally becomes harder.

You do not suddenly become reckless.

You become slightly less precise.

And in trading, slight erosion compounds.

How This Shows Up On Your Chart

This is what mental fatigue looks like in practice:

  • Patience drops
  • Rule adherence softens
  • Risk taking increases
  • Urgency appears where none exists
  • Entry standards slip

You do not say, “I am fatigued.”

You say:

“Maybe this one is ok.”

That sentence has probably cost more traders money than any indicator ever has.

The Uncomfortable Truth

By the time most traders take their worst trade…

They are already mentally depleted.

It is rarely the first trade of the day.

It is often the third.

Or the one taken after trying to claw back -2R.

Not a strategy problem.

An energy problem.

How Professionals Protect Themselves

Professionals do not rely on motivation.

They design around biology.

They:

  • Limit decisions per day
  • Use a daily trading planner.
  • Pre-plan actions before the session
  • Use checklists
  • Automate exits where possible
  • Stop at fixed loss limits
  • Trade fewer, higher quality opportunities

They reduce how often System 2 has to fire.

They preserve decision energy for when it matters most.

Why This Matters If You’re Building Consistency

If you are building a structured, rules-based approach to trading, this is gold.

Performance deterioration is often biological, not intellectual.

You do not need more knowledge.

You need fewer decisions.

Fewer trades.

Higher standards.

Defined stop times.

Hard daily limits.

Because consistency is not just about strategy.

It is about protecting your brain from itself.

There is a quiet truth most traders eventually discover.

You do not need ten indicators. You do not need prediction. You do not need to know what the news will say tomorrow. You need to understand structure.

Market structure is not something added to price. It is price. It is the visible rhythm of expansions and pullbacks. It is the footprint of buyers and sellers competing for control. When you learn to read it properly, it can form a complete, standalone framework for profitability.

Not because it predicts the future.

Because it keeps you aligned with what the market is already doing.

Structure Repeats. Markets move in cycles. Expansion. Pullback. Expansion. Pullback.

On every timeframe this pattern repeats. The only thing that changes is scale.

An uptrend is simply a sequence of higher highs and higher lows.

A downtrend is simply a sequence of lower highs and lower lows.

That is the foundation.

Strip away indicators, oscillators and noise, and this behaviour remains. Structure is simply the market revealing its current bias.

The job is not to forecast the next ten moves.

The job is to recognise the current pattern and participate in it.

The Language of Structure: BoS and CHoCH

To use structure as a trading framework, you need to read two key events correctly.

Break of Structure (BoS)

A Break of Structure occurs when price breaks a previous swing high in an uptrend or a previous swing low in a downtrend.

It confirms continuation.

In an uptrend, a higher high taken out shows strength.

In a downtrend, a lower low taken out shows strength.

BoS tells you the trend is intact.

Change of Character (CHoCH)

A Change of Character happens when price breaks the opposite side of structure for the first time.

In an uptrend, if price breaks a higher low, that is a CHoCH.

In a downtrend, if price breaks a lower high, that is a CHoCH.

It signals a potential shift.

BoS confirms continuation.

CHoCH signals possible reversal.

If you can identify these two events consistently, you can define bias without guessing.

[image required]

Trade The Waves: Expansion and Pullback

Once a Break of Structure confirms direction, price tends to move in waves.

An expansion leg pushes strongly in the direction of the trend.

A pullback retraces part of that move.

Then expansion resumes.

Think of it as a series of waves moving in one direction.

In a bullish trend:

  • Expansion creates a higher high.
  • Pullback retraces.
  • Expansion pushes again.

In a bearish trend:

  • Expansion creates a lower low.
  • Pullback retraces upward.
  • Expansion continues lower.

You do not need to catch the entire move.

You need to participate in the pullback and allow the next expansion to do the work.

Discount and Premium Explained Simply

To improve execution, you need to understand value within each structural leg.

When price expands from a swing low to a swing high, that move forms a range.

Within that range:

  • Discount is the lower half.
  • Premium is the upper half.

In an uptrend:

  • You want to buy in discount.
  • You want to take profit in premium.

In a downtrend:

  • You want to sell in premium.
  • You want to take profit in discount.

It is not about perfection. It is about positioning.

Buying in discount means you are entering at relatively better value inside the recent expansion. Selling in premium means you are exiting into strength.

Repeated consistently, this alone creates structural edge.

[image required]

A Simple Example

Imagine price breaks above a previous high. That confirms bullish structure.

The move from the last swing low to the new high becomes your dealing range.

Price then retraces into the lower half of that range. That is discount.

You enter long during the pullback (once you see The Flip), with your stop below the structural invalidation point, typically beneath the last higher low.

Price expands again and prints a new higher high.

You exit into premium.

No prediction.

No guessing.

Just alignment with structure.

Timeframe Alignment Matters

One common mistake is trading against higher timeframe structure.

You might see a small bullish pullback on a five minute chart while the four hour structure is clearly bearish.

That is fighting the tide or going against market structure

A simple rule improves consistency dramatically:

  1. Identify higher timeframe bias first.
  2. Trade pullbacks on a lower timeframe inside that bias (aligned with the HTF direction)

Higher timeframe structure provides direction.

Lower timeframe structure provides entry.

This keeps you trading with momentum rather than against it.

The Reality Check: Structure can and will fail on you.

Structure is powerful, but it is not certainty.

  • Breaks can fail.
  • CHoCH can be liquidity grabs.
  • Trends can exhaust.

This is where risk management separates theory from profitability.

Your stop belongs beyond the structural invalidation point.

If bullish structure breaks below a higher low, you are wrong.

If bearish structure breaks above a lower high, you are wrong.

Exit. Don’t do anything else. Just Exit

The edge comes from the combination of structure and disciplined risk control. Not from structure alone.

The Six Step Market Structure Framework

Here is the entire approach in simple form:

  1. Identify higher timeframe trend.
  2. Mark the last confirmed Break of Structure.
  3. Define the current dealing range.
  4. Mark discount and premium.
  5. Wait for pullback into value.
  6. Enter with stop beyond structural invalidation.

Repeat until a clear Change of Character occurs.

When structure shifts, reassess.

Why This Alone Can Be Enough

If you:

  • Trade in the direction of confirmed structure
  • Enter during pullbacks
  • Enter in discount and exit in premium
  • Respect structural invalidation
  • Keep average winners larger than average losers

The mathematics begin to work in your favour.

You are trading with momentum.

You are entering at value.

You are exiting when wrong.

You are avoiding emotional chasing at extremes.

That is a complete framework.

Not flashy.

Not complicated.

Not dependent on constant analysis.

Just repetition.

Most traders search for complexity because complexity feels sophisticated.

But markets have been printing higher highs and higher lows long before indicators existed.

Structure repeats.

Human behaviour repeats.

Expansion and pullback repeat.

Profitability is not hidden inside something exotic.

It is built by reading what is already there, waiting for value, and executing the same ordinary process again and again.