Tag Archive for: Market Structure

You placed your final take profit at a level that made sense. A structural high, a measured target, a clean R-multiple. You had a reason for it.

Then the trade went your way. It moved, it built, it looked exactly like it was supposed to. And you closed the whole position. Not a partial — everything. You told yourself it was the right call, that locking in the gain was disciplined, that you were protecting the account.

Then you watched the trade carry on and hit your original target anyway.

This is not a discipline problem. It is not even really a psychology problem. It is a sizing problem, working in reverse.

The same issue as position sizing, wearing a different mask

Last week’s post was about what happens when your position is too large going into a trade. The nerves. The inability to hold a stop calmly. The way a losing trade feels catastrophic when the size is wrong.

The same mechanic applies on the way up.

When your position is oversized, you do not just feel the losses more intensely. You feel the gains more intensely too. A trade that is running in your favour starts to show you a number in green that feels real and meaningful and, critically, fragile. The thought arrives quietly: what if it turns? What if I give all of this back?

So you close it all. You take the full profit early. And you call it sensible.

The trade did not fail. The size made it impossible to sit in.

When your position is oversized, you do not just feel the losses more intensely. You feel the gains more intensely too.

You do not fully trust where your TP is or why

The second reason traders close too early is that they placed a target at a level they do not really believe in.

If you understand market structure, your final TP is at a structural level for a reason. It is where the previous high sits, where liquidity will be drawn, where the market is likely to reach before it decides what to do next. You placed it there because the chart told you to.

But if you placed it there because it looked like a round number, or because someone else suggested it, or because it was “about right,” you will not trust it when the trade is mid-run. The doubt arrives the moment the price pauses or consolidates, and the easiest way to resolve doubt is to exit.

Understanding why your target is where it is makes it much easier to stay in the trade long enough to hit it. The structure holds the stop in place. It holds the target in place too.

Markets move in waves. Pullbacks are not reversals.

Price does not go from your entry to your final TP in a straight line. It pushes, pulls back, consolidates, and then continues. This is normal. It is how markets move.

But when you are watching a trade tick by tick, a pullback mid-run feels like the trade is breaking. You were up a meaningful amount. Now that number is smaller. The instinct is to protect what is left before it disappears entirely.

Most of the time, what you are watching is just the trade breathing. The structure is still intact. The original reason for the trade is still valid. The pullback is not an exit signal. It is the market doing what it always does before continuing.

Stepping away from the screen during a live trade is one of the most underrated skills in trading. The trader who is not watching every tick is usually the one who is still in the trade when the final TP hits.

The part that actually helps: partials and break even

Taking some profit off the table is not the same as closing the whole trade early.

If you have sized correctly and the trade is moving your way, taking a partial at an intermediate level changes the emotional equation. You have locked in something real. The remaining position is now smaller. And if you move your stop to break even at the same time, what is left cannot lose.

That combination – a partial taken at a reasonable point and a stop moved to entry – gives you a guaranteed outcome on the trade. You have already won something. What is left can run to the final TP without the same weight of anxiety sitting on it.

This is not the same as closing everything early. It is managing the trade in a way that lets you hold the rest of it calmly.

The pullback is not an exit signal. It is the market doing what it always does before continuing.

The calculation came before the emotions

Your final take profit was set before the trade opened. You looked at the chart with no position on, no money at risk, no emotional stake in the outcome. You found the level that made sense.

Then the trade opened, money went on the line, and the feelings arrived. The number in green started talking.

The decision to close everything early is made by someone who is inside the trade, watching every tick, feeling the weight of potential loss on a gain that has not yet been secured. The original TP was set by someone who was none of those things.

When those two decisions conflict, trust the one that was made from the outside.

The STRATEGY indicator has two filters that both use EMAs to keep you trading with the trend, but they behave nothing alike. They serve very different purposes. That’s the part worth getting straight, because the shared “EMA” name does most of the confusing.

One checks where a Stage in the STRATEGY Sequence sits against a single moving average line. The other reads the broader, higher-timeframe trend from two moving averages and only reveals setups that align with the overall EMA direction. Both use EMAs as a building block, but they do completely different jobs.

Here’s what each one does, and when to reach for it.

(EMA is short for exponential moving average. It’s a line that follows price but gives more weight to recent candles, so it reacts faster than a plain average.)

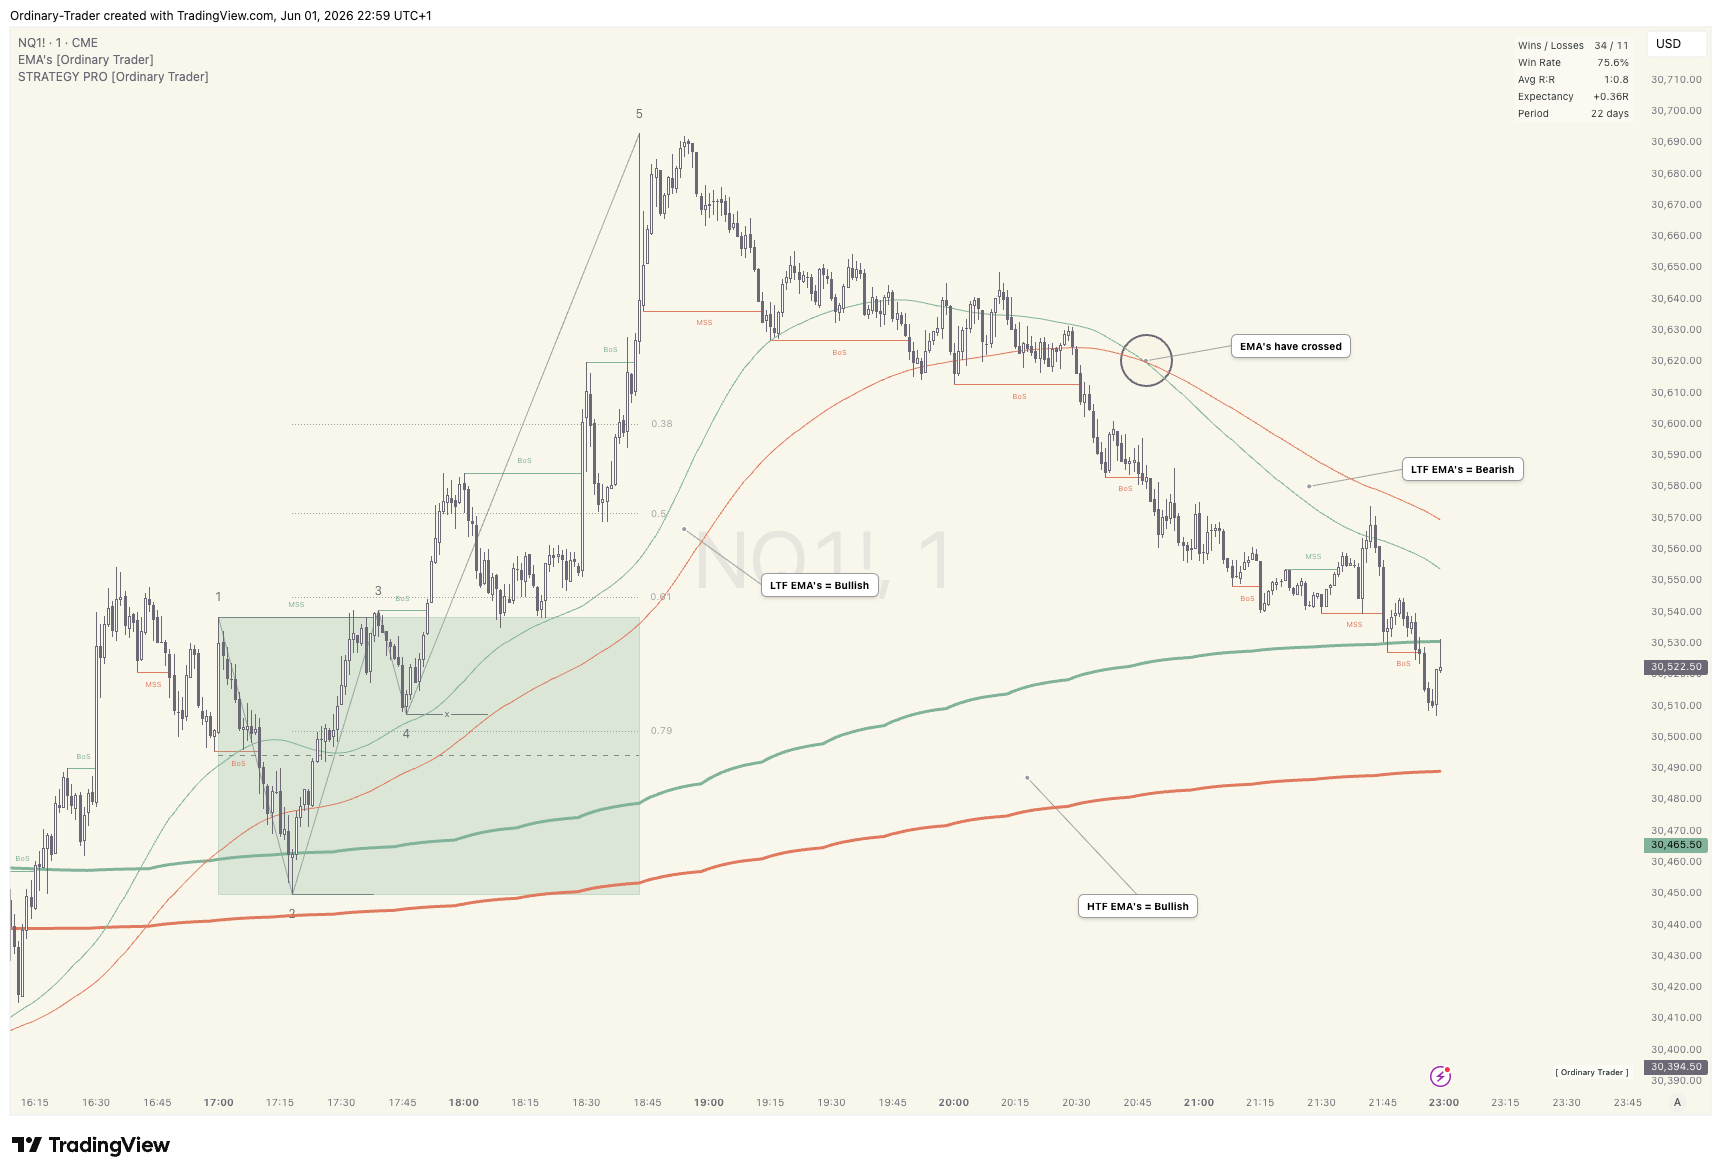
LTF and HTF EMA’s working together

The EMA Filter: one level against one line

The EMA Filter asks a simple question. Where does a specific price level sit relative to a single EMA? If it’s on the wrong side, the setup gets thrown out.

You pick two things. A period (default 50) and a timeframe (default is whatever your chart is on). Then the Apply At setting decides which price level it checks, and at what point in the setup’s life:

  • Sequence Creation: the Step 1 break level, when the sequence first forms.
  • Liquidity: the Step 4 level, when liquidity confirms.
  • Sequence Completion: the Step 5 sweep level, after the sweep.
  • Flip Creation: the flip entry level, the moment the flip triggers.

For a bullish setup, that level has to be above the EMA. For a bearish one, below it.

Say you set Apply At to Flip Creation with the 50 EMA. You’re telling the indicator: only let me into a bullish trade if the flip pivot is above the 50 EMA at the moment it triggers. If it’s below, the setup gets discarded and labelled “EMA” on your chart, so you can see what it removed.

Two things people get wrong here.

First, it’s a one-time snapshot, not a running check. It looks once, at the stage you picked, and that’s it. If the setup passes and price later crosses back over the EMA, the setup stays valid. The filter has already done its job.

Second, “TF = Chart” does not mean the daily 50 EMA. It means whatever timeframe you’re looking at. On a 3 minute chart, it’s the 3 minute 50 EMA. If you want the daily as your reference, set the timeframe to D yourself.

One practical note to close this out. Flip Creation is the strictest option, because it checks right at entry. Sequence Creation is the loosest, because it checks early, before the setup has matured. That’s the trade-off. Filter harder and you cut more setups, including some that would have worked anyway.

The HTF Bias Filter: which way the bigger trend leans

This one works differently. Instead of one price level against one EMA, it looks at two EMAs on a higher timeframe and only allows setups in the direction those two are pointing.

You pick a higher timeframe (I suggest 15 min), a fast EMA (default 50) and a slow EMA (default 100). The rule is plain. Fast above slow means the higher-timeframe bias is bullish, so only bullish setups are allowed. Fast below slow means it’s bearish, so only bearish setups are allowed.

With the defaults, the indicator only reveals bull setups when the daily 50 EMA sits above the daily 100 EMA. If the 50 is below the 100, no bull setups appear on your chart at all. Not even the clean ones. Every other condition can line up and you’ll still see nothing.

There’s no Apply At option here, and that’s on purpose. The higher-timeframe cross is a regime check. It’s about the broader trend, which only matters when a setup first forms. Once a sequence has cleared that gate, the bias can shift later without touching the trade.

The EMA pair is a dial you can turn. Tighter pairs like 20/50 flip bias more often, so more setups but more whipsaws. Wider pairs like 100/300 are steadier, fewer setups but cleaner trend regimes.

Same tool, two different questions

If you only remember one thing, make it this. The EMA Filter compares a price level to one EMA. The HTF Bias Filter compares two EMAs to each other. One judges where your entry sits. The other judges what kind of trend you’re in.

EMA Filter HTF Bias Filter
What it compares A price level vs one EMA Two EMAs against each other
Timeframe Chart or HTF (your choice) Always HTF
When checked Step 1, 4, 5 or Flip (your choice) Always at sequence creation
Rejected setups Visible, labelled “EMA” Never appear at all
Best for Filtering setups by entry location Filtering by broader trend regime

That difference in purpose is the thing to hold on to. One is a precision tool for a single setup. The other is a broad gate for the whole session. They answer different questions, so they’re not really alternatives. They’re a pair.

Can you run both at once?

Yes, and they pair well. The HTF Bias Filter gives you the broad regime, the kind of trend you’re trading inside. The EMA Filter then refines individual setups within that trend, checking where the entry sits against a closer moving average.

Turn both on and the filters stack. A setup has to clear the higher-timeframe regime check and the price-level check before it earns a place on your chart. Stricter, fewer setups, but every one that survives has passed both questions.

Which is the point of a filter in the first place. It isn’t there to give you more trades. It’s there to quietly remove the ones that don’t fit, before you ever have to decide.

Trade well. Stay ordinary.

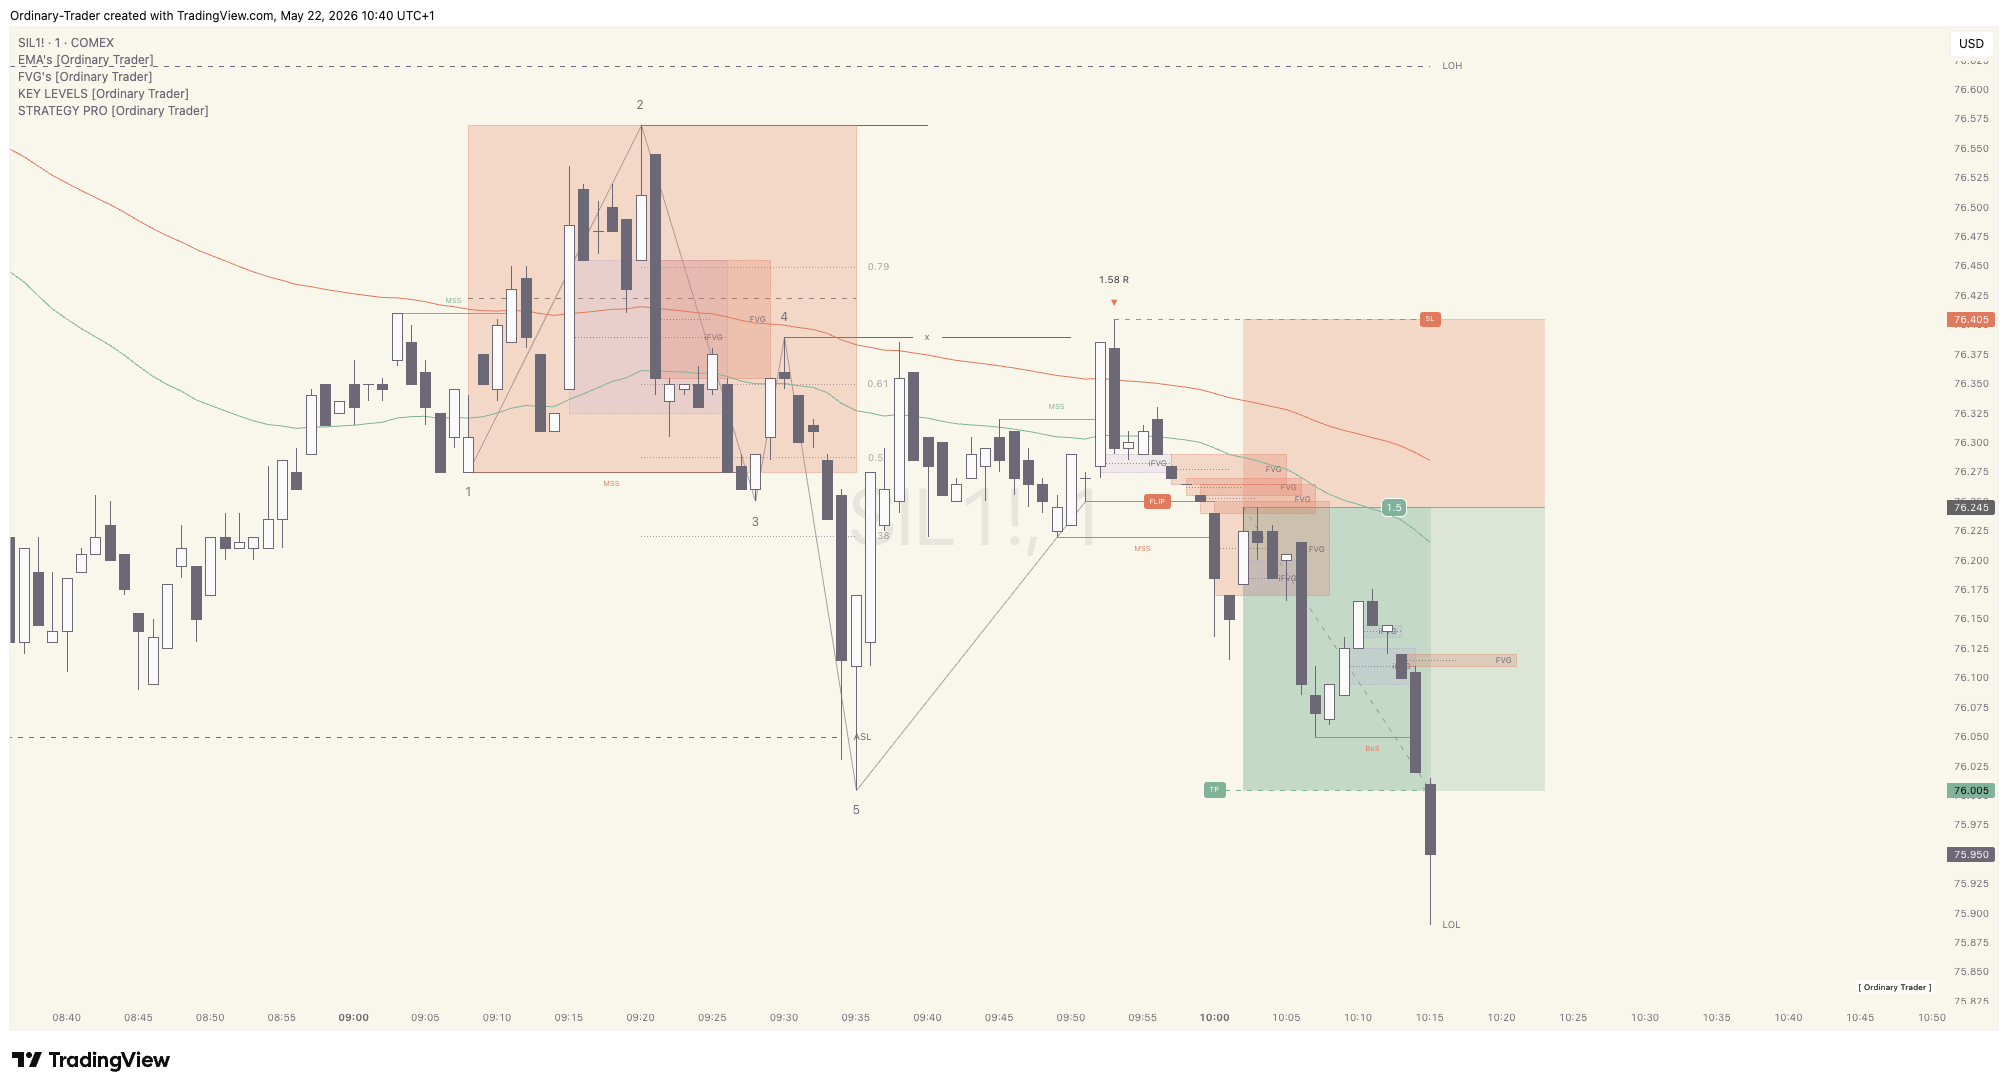
Silver futures, just after 10am London time. The 1-minute chart had been grinding lower into the session. Bearish bias was there on the higher timeframes, and the indicator was painting a five-point sequence I’ve now seen play out enough times to know what to look for.

The trade ran 1.58R with effectively zero drawdown.

But the result isn’t the point. The setup is. Most sequences that print on the indicator are fine. They work often enough. The A+ ones look different, and once you’ve watched a few play out, you stop being willing to risk real money on the average ones.

Here’s what made this one A+, walking through it in roughly the order it printed.

The geometry has to make sense first

Before anything else, I’m looking at the distance between Step 3 and Step 5.

Step 3 is the swing low we want to see break out of the zone. Step 5 is the deeper swing low that completes the bearish structure, the furthest point from the zone before price heads back toward our liquidity at Step 4. A short distance between (3) and (5) means the pullback is shallow and the R:R gets compressed before you’ve even started.

This trade had room. Step 5 sat a meaningful distance below Step 3, which meant any pullback back up into Step 4 had to be substantial. A substantial pullback means a deeper entry, a tighter stop relative to the target, and a setup that’s worth taking risk on. If the geometry’s wrong, nothing else on the chart matters.

The depth of the Step 4 tap

The second filter is how price interacts with the Step 4 zone.

What I want to see is a clean sweep of (4) and an immediate rejection, not a deep mitigation well beyond (4). On this trade, price came back into the zone, wicked (4), and turned. That’s the indicator’s job, to observe, track and display these sequences as they play out, and it did it.

What made it A+ rather than just acceptable was what other confluences we could observe around that tap. The rejection came off a bearish fair value gap (FVG), an unfilled imbalance left by an earlier full-bodied bearish candle. So it wasn’t just price sweeping the liquidity at (4) and turning. It was price sweeping liquidity, hitting fresh bearish imbalance from a candle that had real intent behind it, and refusing to push through.

That’s not a coincidence. That’s sellers showing up exactly where you’d expect them to.

The Flip and what sits around it

The Flip is my entry trigger, the moment the indicator confirms a structural break in the direction of the original bias. On its own, it’s a signal. With the right context around it, it’s a different category of signal.

What I want to see around The Flip

Two things gave this one extra weight.

First, fresh bearish FVGs started forming right after The Flip. Multiple of them. That tells me the move down isn’t a one-candle reaction, it’s a sequence with momentum behind it. Each new FVG is an unfilled gap, and unfilled gaps are evidence that price is moving with intent rather than chopping.

Second, The Flip printed below both the 50 and 100 EMA. This one’s a hard filter for me in bearish setups, and I’ve built it directly into the indicator. If The Flip is above the 50 EMA, I’m probably looking at a counter-trend reversal, and counter-trend trades are a different beast. Below the 50 EMA, in an already bearish higher-timeframe context, means I’m taking continuation in the direction of the trend. The old adage holds up here, the trend is your friend, and on this setup everything was pointing the same way.

Execution becomes easy when the setup is right

Here’s the part I want to be honest about. When the setup is genuinely A+, execution stops being the hard part.

On this trade, I set my entry exactly on the flip line. There was zero drawdown. Not “almost zero,” literally none, because price had already committed to the move before The Flip printed, and the entry sat at the boundary of that commitment.

When price pushed close to 1R, I moved my stop to break even. That’s the rule, and it didn’t require any negotiation with myself. Target was Step 5, same as always.

After a minor pullback (the kind that always shows up and always feels worse than it is), price continued down. Two more fresh bearish FVGs formed on the way. TP hit cleanly.

The trade took care of itself, because everything that needed to be true at entry was already true.

A+ setups are filters, not formulas

The reason I keep using the phrase A+ instead of just “valid” is that the indicator will give you valid signals all day long. A large percentage of them will work. The job isn’t to take all of them.

The job is to wait for the ones where the geometry, the conditions of the sweep, the quality of the rejection, the freshness of the imbalance, and the EMA position all line up the same way.

You won’t get many of these every session, sometimes only 1 or 2 a week.

That’s fine. The discipline is in the waiting, not the trading.

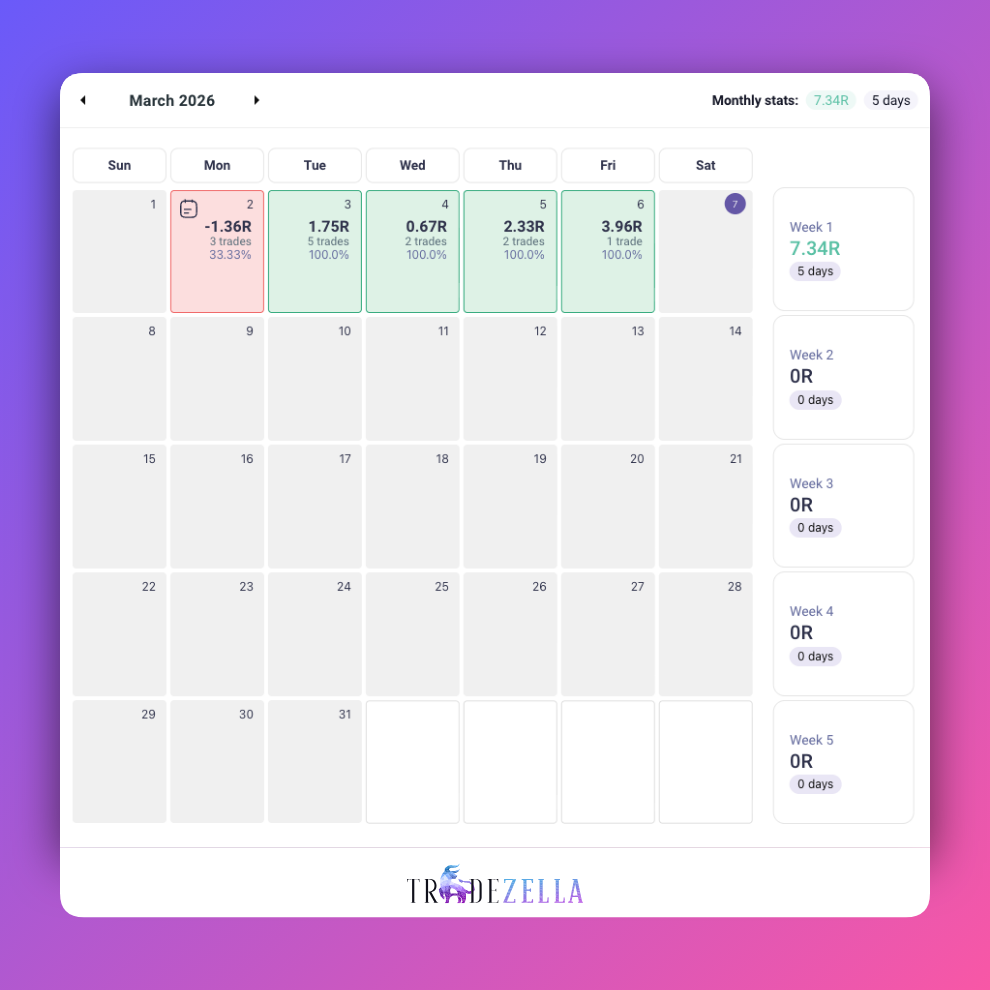
March 2 – March 6

Week 10 started with a red day.

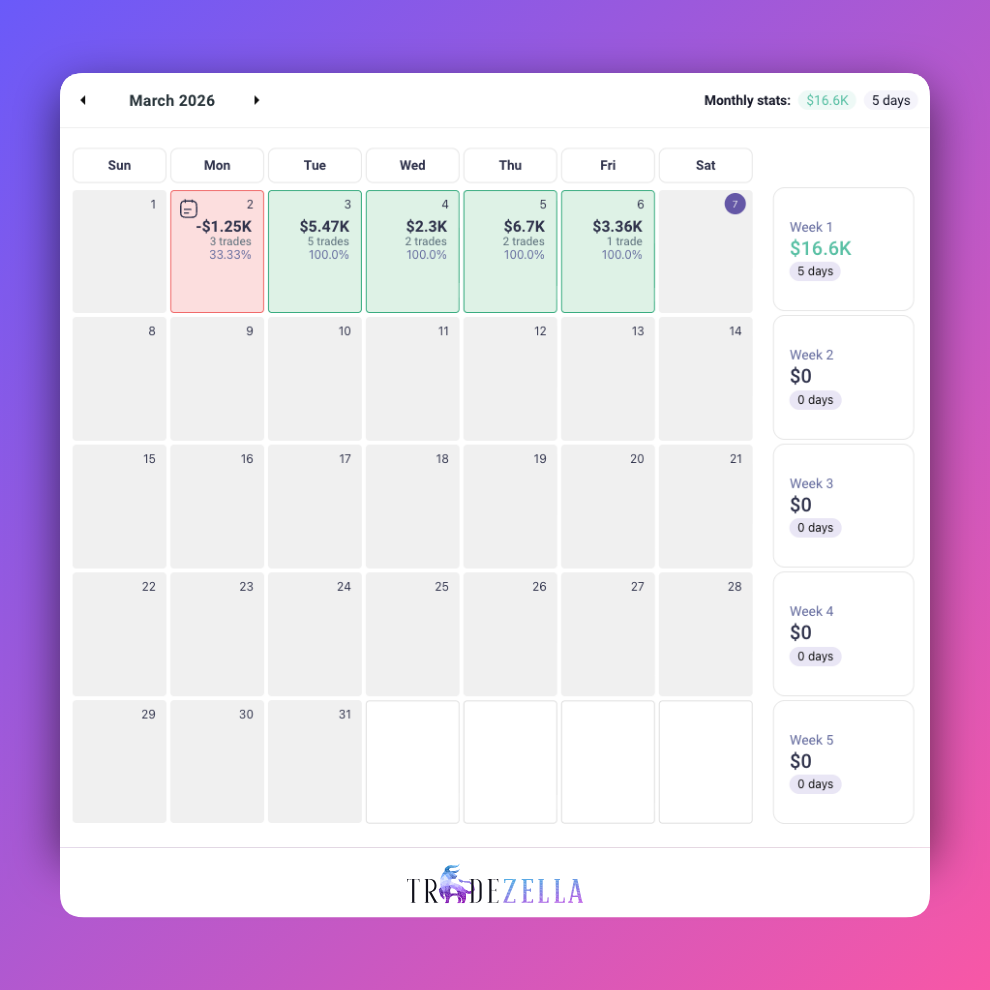
Not the ideal way to begin a new week or a new month. The session closed -1.36R (-$1.25K), which was a small confidence knock if I am honest. But the important thing is what happened next. I did not change the strategy. I did not try to force trades to make the loss back.

I simply stayed with the strategy and the trading plan.

What followed were four straight green days, each closing with a 100 percent win rate. Across those four sessions I put together a 10 trade win streak, bringing the week to +7.34R (+$16.6K).

The numbers are nice, but the bigger story this week was a shift in how I am reading the market.


A Timeframe Shift

This week I experimented trading less on the 15 minute TF for structure with 1 minute entries and began working with 1 hour structure and 5 minute entries.

The difference has been noticeable almost immediately.

Market structure simply feels more reliable. Breaks on the 5 minute and 1 hour charts carry slightly more weight due to their HTF mature. On the 1 minute chart, moves could feel a bit noisy and erratic, which made it easy to react to price movements that ultimately did not matter.

With the higher timeframe perspective, everything slows down.

Trades are now lasting four to six hours, compared with the 15 to 60 minutes that was typical before. That extra time creates a calmer environment. Instead of constantly searching for the next entry, there is space to observe price behaviour and manage trades more deliberately.

There is a trade off though. Holding positions longer means greater exposure to scheduled news events, which is something I now need to manage more carefully.

Quality Over Quantity

Another clear change is the number of trades.

When I was working from the 1 minute chart it was easy to take five to eight trades per day, which sometimes led to rushed decisions and lower quality setups.

With the new approach, opportunities appear less frequently. But when they do, the structure is clearer and the reasoning behind the trade is stronger.

Risk to reward is improving as well. Previously many trades capped out around 1.5R, but this week I captured a 4R trade, something that was far less common under the faster approach.

The result is straightforward.

Fewer trades.
Better trades.

The Key Takeaway

Week 10 reinforced an important lesson.

Speed creates noise.
Slowing down creates clarity.

The move to higher timeframe structure has changed the rhythm of the trading day. Decisions feel calmer, setups feel more intentional, and the overall environment is far less reactive.

Week 10 closed +7.34R (+$16.6K), but the more important shift is in the process.

The charts are quieter.
The decisions are calmer.
And the trades carry more weight.

A real trade journal example of SMT divergence using NQ and ES. See how correlation breaks, liquidity shifts, and market structure alignment create high probability setups.

Have you ever watched a clean breakout on NQ, felt that surge of confidence, clicked in… and then watched it snap back like it never meant it?

It happens. And when it does, it feels personal.

Here’s the thing. Sometimes the breakout isn’t wrong. It’s just lonely.

That’s where SMT comes in.

SMT, or Smart Money Technique divergence, is a concept popularised by Michael J. Huddleston. Strip away the branding and what you’re left with is simple: when two markets that usually move together stop agreeing, pay attention.

It’s not prediction. It’s not a crystal ball. It’s context.

And when you’re trading sweeps, displacement, and structure shifts on 15m and 1m, context is everything.

First, Why ES and NQ Even Matter Together

We’re talking about S&P 500 Index futures (ES) and NASDAQ-100 futures (NQ).

These two are close cousins. Different personalities, same family.

They move together because:

Same Macro Drivers

Both respond to:

  • Interest rates
  • Inflation data
  • Fed commentary
  • Risk on / risk off flows
  • US economic data

If the market is broadly buying equities, both rise.

If fear hits, both sell.

Simple.

Heavy Tech Overlap

Mega cap tech dominates both indices. When Apple, Microsoft, or Nvidia move, both ES and NQ feel it. Big money flows hit them at the same time.

So most of the time, they confirm each other.

Which is exactly why it matters when they don’t.

But They’re Not Identical, And That’s The Opportunity

Here’s where it gets interesting.

  • NQ moves faster
  • NQ respects structure differently
  • NQ overshoots more
  • ES is smoother

NQ is like the energetic sibling. Quick. Emotional. Aggressive. It runs highs and sweeps lows with conviction. ES is steadier. Broader. It grinds levels instead of exploding through them.

If you trade 15m for bias and 1m for entries, you’ve probably felt this already.

In practical terms:

  • ES tends to give cleaner higher timeframe structure
  • NQ tends to give sharper lower timeframe reactions
  • NQ rewards precision more but punishes size harder

A lot of traders use ES for bias and execute on NQ. Not because it’s clever. Because it makes sense. One gives clarity. The other gives movement.

And movement is where your edge lives.

So What Is SMT, Really?

SMT shows up at liquidity.

Equal highs. Equal lows. Session extremes. Obvious 15m levels where everyone can see the stops sitting.

Now imagine both ES and NQ approach equal highs.

One breaks.

The other doesn’t.

That’s SMT.

In a bearish scenario, one index makes a higher high while the other fails to confirm. Buy side liquidity gets swept in one market, but not the other. If the broader equity complex were genuinely strong, both should expand together.

When only one runs the stops, something feels off. That breakout might be distribution.

In a bullish scenario, one index sweeps sell side liquidity below prior lows, and the other refuses to break. That relative strength hints that the breakdown may be engineered.

It’s subtle. But it’s powerful.

SMT isn’t the entry. It’s the raised eyebrow before the move.

Bringing It Into A 15m / 1m Model

Let me explain how this fits into a structured approach.

On the 15m chart, you mark liquidity on both ES and NQ. Equal highs. Equal lows. Protected highs and lows. Clean swing points. That’s your map.

When price approaches those areas, you watch behaviour.

If one index sweeps liquidity and the other doesn’t confirm, you don’t jump in. You wait.

Then you drop to the 1m.

You look for:

  • Change of character
  • Displacement
  • Clear structure shift
  • Defined risk in premium or discount

Now your trade isn’t just a sweep. It’s a sweep plus divergence plus structure.

That’s different.

That’s layered probability.

How Do You Know Which Index Is Leading?

This is the part most traders skip.

If one index breaks and the other doesn’t, how do you know which one to trust?

Keep it simple.

Ask yourself:

  • Which index has been trending cleaner during the session?
  • Which index is showing stronger displacement?
  • Which index is respecting structure better?
  • Which index holds above a breakout level instead of instantly rejecting?

The stronger index tends to confirm real moves.

The weaker index tends to produce failed breaks and liquidity sweeps.

It’s not about who moved first.

It’s about who holds.

That distinction often decides whether you trade continuation or fade the move.

What SMT Is Not

SMT is not:

  • A standalone strategy
  • A guaranteed reversal signal
  • A reason to trade against trend blindly
  • A shortcut around confirmation

It is context layered onto structure.

Without structure, it’s just observation.

A Final Thought

Incorporating SMT into your strategy can feel like a glimpse into the future.

When a sweep occurs in one index and is rejected by the other, reversal probability increases. Not always. But often enough to matter.

That extra layer of context often turns average setups into A+ opportunities.

You’re still trading structure. You’re still managing risk. You’re still waiting for confirmation.

But now you’re asking a better question before you commit:

Is this move confirmed?

It is one of the most common questions in trading.

Should you trade the 1 minute?

The 15 minute?

The 4 hour?

The Daily?

The honest answer is simple.

Any timeframe works.

Market structure is fractal. A break of structure on the 1 minute behaves the same way as a break of structure on the 4 hour. Pullbacks, expansions, premium and discount all exist on every chart.

The difference is not validity.

It is speed.

Lower timeframes move faster.

Higher timeframes move slower.

But structurally, they follow the same logic.

So the real question is not which single timeframe is best.

The better question is which timeframe pairing makes sense.

Timeframes Work in Pairs

Trading from a single timeframe often creates blind spots.

You either have context with no precision, or precision with no context.

The solution is pairing.

One timeframe defines intent.

The other defines execution.

For example:

  • 15m defines structure and location
  • 1m confirms entries

Or:

  • 1H defines structure
  • 5m confirms entries

Or:

  • 4H defines structure
  • 15m confirms entries

The timeframe itself is not special.

The relationship between them is.

The 12 to 16x Rule

A practical guideline is to keep your timeframe separation in the 12 to 16x range.

Examples:

  • 1H to 5m equals 12x
  • 15m to 1m equals 15x
  • 4H to 15m equals 16x

This range creates a meaningful shift in perspective without disconnecting execution from intent.

If timeframes are too close, you are looking at almost the same structure twice.

If they are too far apart, the lower timeframe flips repeatedly while the higher timeframe barely moves.

The gap becomes unstable.

The 12 to 16x range keeps the structure aligned.

So What Is the Best Timeframe to Trade?

The best timeframe is the one that:

  • Matches your lifestyle
  • Matches your psychological tolerance
  • Matches your ability to focus
  • Can be paired properly with a higher timeframe

There is nothing magical about the 1 minute, the 15 minute, or the 4 hour.

They all work.

What matters is:

  • Clear role separation
  • Proper ratio
  • Structural consistency

Choose a pairing.

Define the roles.

Keep the ratio consistent.

The timeframe is not the edge.

Structure is.

There is a quiet truth most traders eventually discover.

You do not need ten indicators. You do not need prediction. You do not need to know what the news will say tomorrow. You need to understand structure.

Market structure is not something added to price. It is price. It is the visible rhythm of expansions and pullbacks. It is the footprint of buyers and sellers competing for control. When you learn to read it properly, it can form a complete, standalone framework for profitability.

Not because it predicts the future.

Because it keeps you aligned with what the market is already doing.

Structure Repeats. Markets move in cycles. Expansion. Pullback. Expansion. Pullback.

On every timeframe this pattern repeats. The only thing that changes is scale.

An uptrend is simply a sequence of higher highs and higher lows.

A downtrend is simply a sequence of lower highs and lower lows.

That is the foundation.

Strip away indicators, oscillators and noise, and this behaviour remains. Structure is simply the market revealing its current bias.

The job is not to forecast the next ten moves.

The job is to recognise the current pattern and participate in it.

The Language of Structure: BoS and CHoCH

To use structure as a trading framework, you need to read two key events correctly.

Break of Structure (BoS)

A Break of Structure occurs when price breaks a previous swing high in an uptrend or a previous swing low in a downtrend.

It confirms continuation.

In an uptrend, a higher high taken out shows strength.

In a downtrend, a lower low taken out shows strength.

BoS tells you the trend is intact.

Change of Character (CHoCH)

A Change of Character happens when price breaks the opposite side of structure for the first time.

In an uptrend, if price breaks a higher low, that is a CHoCH.

In a downtrend, if price breaks a lower high, that is a CHoCH.

It signals a potential shift.

BoS confirms continuation.

CHoCH signals possible reversal.

If you can identify these two events consistently, you can define bias without guessing.

[image required]

Trade The Waves: Expansion and Pullback

Once a Break of Structure confirms direction, price tends to move in waves.

An expansion leg pushes strongly in the direction of the trend.

A pullback retraces part of that move.

Then expansion resumes.

Think of it as a series of waves moving in one direction.

In a bullish trend:

  • Expansion creates a higher high.
  • Pullback retraces.
  • Expansion pushes again.

In a bearish trend:

  • Expansion creates a lower low.
  • Pullback retraces upward.
  • Expansion continues lower.

You do not need to catch the entire move.

You need to participate in the pullback and allow the next expansion to do the work.

Discount and Premium Explained Simply

To improve execution, you need to understand value within each structural leg.

When price expands from a swing low to a swing high, that move forms a range.

Within that range:

  • Discount is the lower half.
  • Premium is the upper half.

In an uptrend:

  • You want to buy in discount.
  • You want to take profit in premium.

In a downtrend:

  • You want to sell in premium.
  • You want to take profit in discount.

It is not about perfection. It is about positioning.

Buying in discount means you are entering at relatively better value inside the recent expansion. Selling in premium means you are exiting into strength.

Repeated consistently, this alone creates structural edge.

[image required]

A Simple Example

Imagine price breaks above a previous high. That confirms bullish structure.

The move from the last swing low to the new high becomes your dealing range.

Price then retraces into the lower half of that range. That is discount.

You enter long during the pullback (once you see The Flip), with your stop below the structural invalidation point, typically beneath the last higher low.

Price expands again and prints a new higher high.

You exit into premium.

No prediction.

No guessing.

Just alignment with structure.

Timeframe Alignment Matters

One common mistake is trading against higher timeframe structure.

You might see a small bullish pullback on a five minute chart while the four hour structure is clearly bearish.

That is fighting the tide or going against market structure

A simple rule improves consistency dramatically:

  1. Identify higher timeframe bias first.
  2. Trade pullbacks on a lower timeframe inside that bias (aligned with the HTF direction)

Higher timeframe structure provides direction.

Lower timeframe structure provides entry.

This keeps you trading with momentum rather than against it.

The Reality Check: Structure can and will fail on you.

Structure is powerful, but it is not certainty.

  • Breaks can fail.
  • CHoCH can be liquidity grabs.
  • Trends can exhaust.

This is where risk management separates theory from profitability.

Your stop belongs beyond the structural invalidation point.

If bullish structure breaks below a higher low, you are wrong.

If bearish structure breaks above a lower high, you are wrong.

Exit. Don’t do anything else. Just Exit

The edge comes from the combination of structure and disciplined risk control. Not from structure alone.

The Six Step Market Structure Framework

Here is the entire approach in simple form:

  1. Identify higher timeframe trend.
  2. Mark the last confirmed Break of Structure.
  3. Define the current dealing range.
  4. Mark discount and premium.
  5. Wait for pullback into value.
  6. Enter with stop beyond structural invalidation.

Repeat until a clear Change of Character occurs.

When structure shifts, reassess.

Why This Alone Can Be Enough

If you:

  • Trade in the direction of confirmed structure
  • Enter during pullbacks
  • Enter in discount and exit in premium
  • Respect structural invalidation
  • Keep average winners larger than average losers

The mathematics begin to work in your favour.

You are trading with momentum.

You are entering at value.

You are exiting when wrong.

You are avoiding emotional chasing at extremes.

That is a complete framework.

Not flashy.

Not complicated.

Not dependent on constant analysis.

Just repetition.

Most traders search for complexity because complexity feels sophisticated.

But markets have been printing higher highs and higher lows long before indicators existed.

Structure repeats.

Human behaviour repeats.

Expansion and pullback repeat.

Profitability is not hidden inside something exotic.

It is built by reading what is already there, waiting for value, and executing the same ordinary process again and again.

Crude oil, mid-afternoon into the New York session.

The higher-timeframe picture had already shifted. After a sustained downtrend, price showed a clear change of character and then a break of structure back to the upside. The bias was no longer the question.

Execution was.

I’d already had a win earlier in the session on a similar-looking long. That mattered more than I wanted it to. Confidence was up, but so was the temptation to assume the next trade would behave the same way.

As price pulled back, I was watching two things closely. A bearish M15 fair value gap above, likely to cause early resistance and chop. And deeper liquidity and SNDR zones closer to the 78.6 retracement, which is where I initially expected price to go.

It didn’t.

Instead, price flipped cleanly at the 61.8. The reaction was decisive. We had inversion of a fair value gap, followed by the creation of new bullish imbalance. The entry was there, even if it wasn’t the one I’d mentally rehearsed.

So I took it.

Early on, the trade behaved exactly as expected. Some hesitation. Sideways action into the M15 fair value gap. Nothing smooth, nothing impulsive. I trailed my stop as structure allowed, keeping it logical, not aggressive.

There was a moment where price pushed deep into that M15 imbalance and looked like it might stall completely. I considered taking profit early. It would have been less than one R, and that’s where the internal debate started.

Technically, banking something would have felt good. Emotionally, it would have been comfortable. But it would also have broken a rule I’ve set deliberately: no profit-taking below minimum expectancy unless it’s earned via structure-based stop management.

So I did nothing.

I moved the stop to break-even, not because I was afraid, but because structure justified it.

Eventually, the M15 fair value gap broke. That mattered. It changed the context of the trade, not just the open P&L. I moved the stop to break-even, not because I was afraid, but because structure justified it.

Targets were still ahead.

My first target was set just under a five-minute fair value gap that had the potential to act as resistance that late in the move. Only after the trade was live did I realise that target also sat just above the New York high. An obvious magnet. Possibly an obvious rejection point.

I let it play out.

When price traded into that level and TP1 was hit, the management became simpler. Stop to break-even. No decisions left to negotiate with myself. When the five-minute fair value gap inverted, I trailed the stop again, just beneath the new structure.

From there, the trade did the rest of the work.

The lesson here isn’t about entries or setups. It’s about restraint once the trade is on.

Most mistakes don’t come from bad analysis. They come from trying to improve a trade that’s already working.

Most mistakes don’t come from bad analysis. They come from trying to improve a trade that’s already working. Taking profits because something feels obvious. Adjusting stops because price pauses. Optimising for emotional relief instead of following the plan through.

This trade worked because I stayed aligned with my rules even when the market gave me reasons not to. Earlier confidence didn’t turn into overreach. Late-session hesitation didn’t turn into fear-based exits.

The takeaway is simple.

If the trade plan still makes sense, and structure hasn’t changed, the most disciplined action is often to stop managing and start observing. Let the market decide how far it wants to go.