
Tag Archive for: Drawdown

Copy trading changes one thing. It multiplies the outcome of your trade.

Every good decision lands on ten accounts instead of one. BUT…. so does every bad one.

When I first connected a trade copier across my prop accounts (I use TradeSyncer btw), the wins felt effortless. Then came the first proper red day, and I watched the same loss print ten times over. Nothing about my trading had changed. Only the exposure had.

Something clicked that day and I realised that taking the trade is the easy part. Managing the exposure around it is the real work. These are the ten rules I’ve settled on to help scale prop accounts when using trade copiers.

1. Go slow and let small wins compound

Scaling from one account to ten turns a normal 1R loss into a 10R hit to the book. Big days are great, but the losing days grow at exactly the same rate.

I’d rather bank a steady +1R across a group of accounts, day after day, than chase a big one and hand it back. Small wins compound. Big losses reset the clock.

2. Rotate and segment your accounts

You don’t need to trade every account all of the time. When the market is trending cleanly, running the full book makes sense. In choppy or uncertain conditions, it doesn’t.

I trade in batches of 5 to 10 accounts, take a win, then move to the next batch. Splitting by session works too, with half the accounts on the NY open and half in Asia or London. One bad session can then only touch part of the book.

3. Make a funded account your leader

I set a funded account as the leader and almost forget the evals exist. I trade the funded exactly as I normally would, and the evals follow.

Most eval mistakes come from the pressure of needing to pass. Remove that, trade well, and the evals convert as a by-product rather than the goal.

4. Use ratio multipliers on fresh evals

TradeSyncer lets you set a ratio multiplier on each follower. I’ll sometimes put a fresh eval on 2x, so a $200 risk on the leader becomes $400 on the eval. The funded keeps trading as normal while the eval reaches its outcome faster, pass or fail.

Be honest with yourself here. 2x doubles the losses too. It doesn’t make passing more likely. It makes the answer arrive sooner, which frees up the slot for the next attempt.

5. Build a bench of backup evals

Once a funded account has paid out, I start thinking about its replacement. Lucid allows five funded accounts at a time, so once mine are paying I add a few Lucid evals and work them towards funded.

Funded accounts eventually blow. That’s part of the job. When one does, a passed eval is ready to step straight in and there’s no downtime.

6. Know every firm’s rules before you copy

Not every firm allows copy trading, and some restrict trading the same strategy across firms. Hedging (holding opposite positions across accounts) is banned almost everywhere. Drawdown type, consistency rules and payout conditions all differ too.

Read the rules for every firm you connect. Accounts fail for rule breaches that have nothing to do with the quality of the trade.

7. Group accounts by rule set, not just by firm

An intraday trailing drawdown tracks your open profit in real time. A trade that runs $800 in your favour and comes back to breakeven has quietly raised your floor. On an end-of-day trailing account, it hasn’t.

Same trade, very different outcome. Keep accounts with matching size and drawdown mechanics together, so one trade means the same thing to every follower.

8. Put hard daily limits on every account

Every account gets a daily loss limit and a daily profit target (DPT). My funded accounts run a $1,000 loss limit against a $2,000 max drawdown, so one bad day can’t take more than half the buffer.

The profit target matters just as much, and it should be set in line with the firm’s consistency rule. On my evals the profit target is $3,000 (50k to 53k) with a 50% consistency rule, meaning no single day can make up more than half the total. That puts the DPT at $1,500. Hit it and the account locks for the day.

The same logic applies to any funded account with a consistency requirement on payouts. Set the target so a great day can never make you ineligible.

Check how the DPT interacts with your multipliers, too. A $750 day on the leader becomes $1,500 on a 2x eval, right at the cap.

9. Check the copies, not just the leader

Copiers are good, not perfect. Slippage, partial fills and the occasional disconnect happen.

I spot check follower fills against the leader after each session, and I know exactly where the flatten-all button is before I place a trade. Don’t assume every account did what the leader did.

10. Treat it like a business

Track eval fees against payouts, firm by firm. Some firms will earn their place, some won’t.

Stagger payout cycles so income doesn’t arrive in lumps, and spread across more than one firm, so a single firm changing its rules doesn’t take down the whole operation. It’s a book of accounts. Run it like one.

Same trade, managed better

None of this changes how I read a chart or where I enter. The Strategy is the same whether I’m trading one account or twenty.

What changes is everything around it: which accounts are live, how much each one can lose, and what’s waiting on the bench. That’s where copy trading is won or lost. Quietly, and mostly before the session starts.
This is the first post in a new monthly series where I share my real trading results.

Not highlights. Not best days only. Not a sales pitch.

Just the numbers, the behaviour behind them, and what I am learning as I go.

The aim is simple. To track progress over time, stay accountable to my own rules, and hopefully provide something more realistic than the polished versions of trading that usually get shared.

This is Month 1.

How to Read the Images

Before getting into the results, a quick note on how to interpret the screenshots.

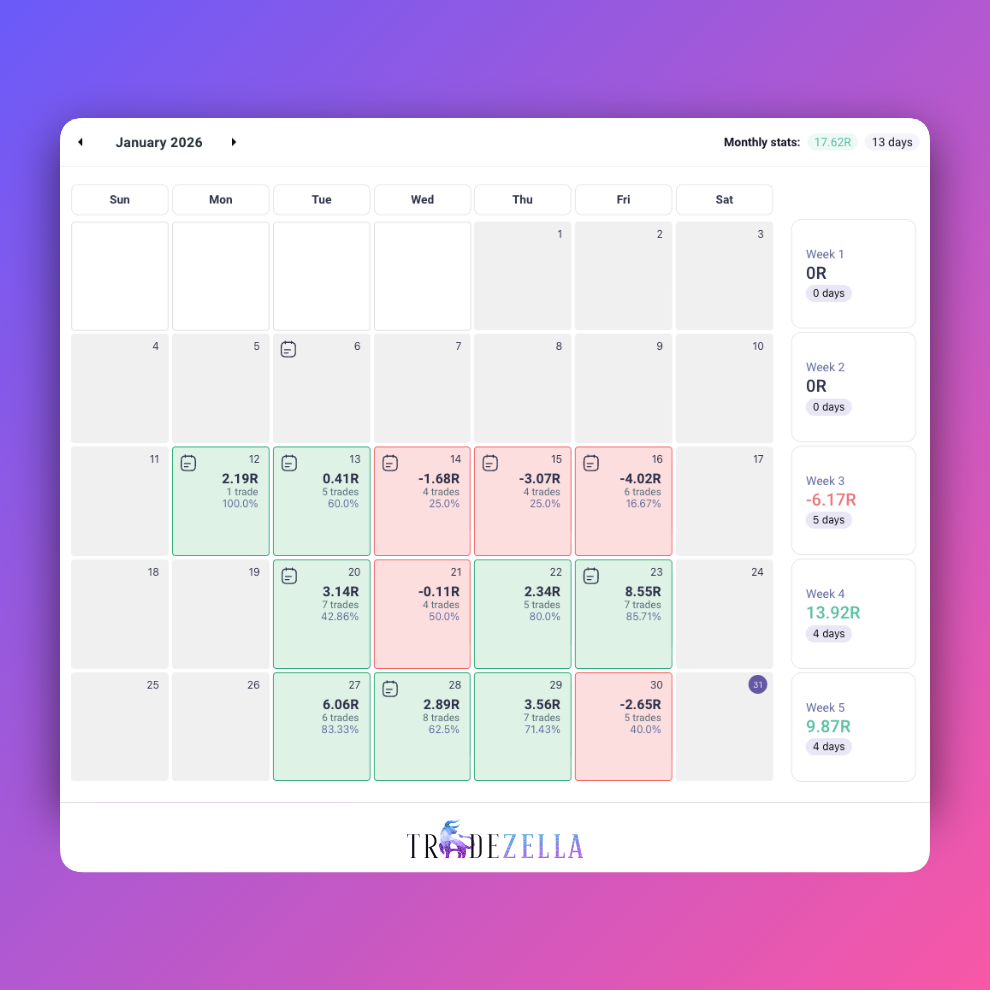
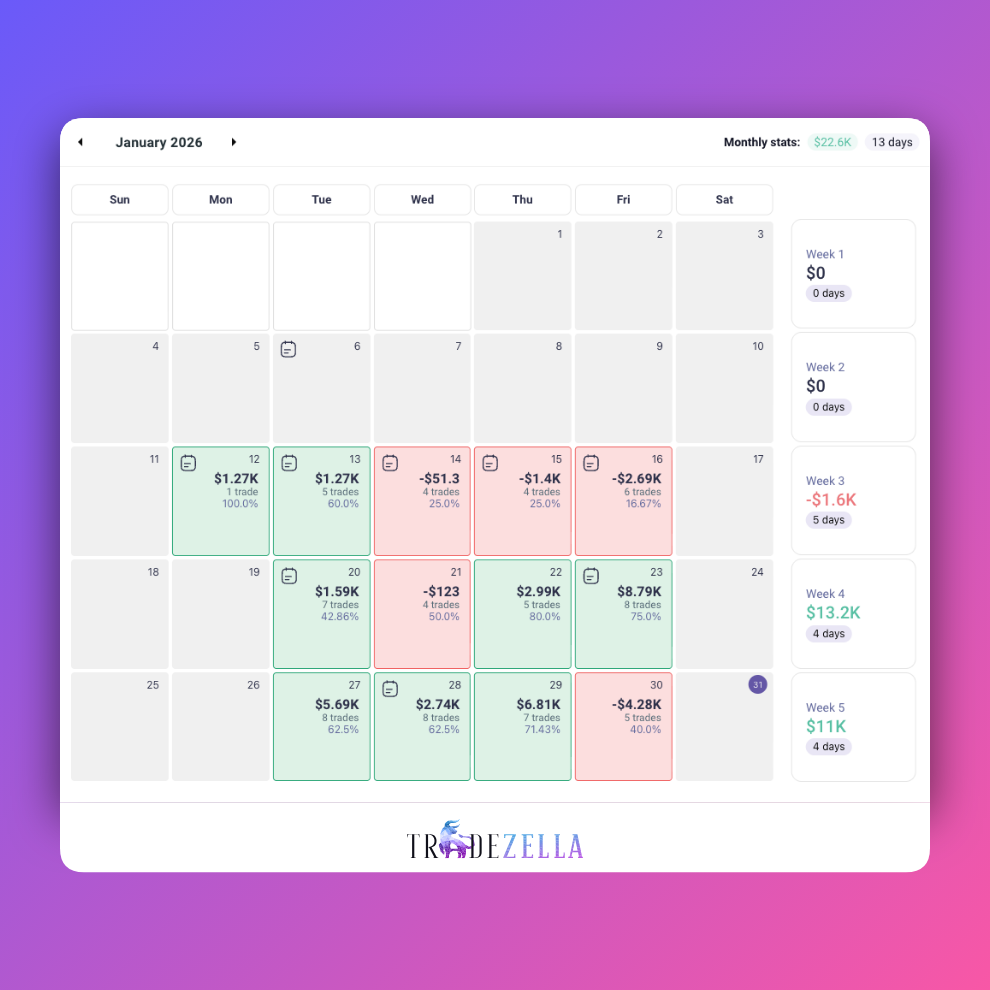
Each day shows both R and dollar PnL.
R measures performance relative to risk. Dollars show the real-world impact of those decisions.

Green and red days are not the story on their own. What matters more is trade count, win rate, and how losses behave when things are not going well.

If you are new to this, think of R as the decision-making lens, and dollars as the consequence.

Both matter, but they play different roles.

Why I Still Think in R First

R remains my primary metric because it keeps the focus on process rather than outcome.

It standardises risk, removes position size bias, and makes performance comparable across days, weeks, and months. A +3R day achieved cleanly is far more useful information than a random dollar figure taken out of context.

The dollar view exists to keep things honest. It reminds me that risk is real and that behaviour has consequences. But it is not what drives decisions in the moment.

R governs the process. Dollars reflect the result.

The worst red days tend to follow periods of over-engagement, often driven by trying to make something back within the same session.

The Big Picture

This month was uneven, but instructive.

Firstly, I only started journalling from Monday the 12th. The 19th was a stock market holiday, and I took the 26th off to attend a person training course. So this was not a full, uninterrupted trading month.

Even so, clear patterns emerged.

There was one difficult drawdown week early on, followed by two strong weeks where execution, discipline, and consistency improved noticeably. The contrast between those periods is the most important takeaway from this review.

The Difficult Start

Week 3 finished down -6.17R, or roughly -$1.6K.

More important than the number is how it happened.

This was before I was properly journalling, and it shows. Win rates were low, trade counts were high, and patience was thin. Losses clustered, not because the strategy stopped working, but because behaviour slipped.

There was some overtrading, some forcing, and a tendency to try to recover losses within the same session. In hindsight, the red days were not surprising.

At the time it felt frustrating. In review, it feels useful.

What Changed

From the 12th onwards, things began to stabilise.

Not perfectly, and not immediately, but enough to notice. Journalling introduced friction. It forced me to slow down, articulate reasons for entries, and reflect on exits rather than rushing to the next setup.

Even later red days still finished negative, but the damage was contained. Losses did not spiral, and trade behaviour stayed more deliberate.

That shift alone feels like progress.

The Stronger Weeks

Weeks 4 and 5 were the most encouraging.

Together they produced +23.79R, or just over $24K, with win rates regularly in the 60 to 80 percent range. These were not single outsized trades or lucky spikes. They came from multiple trades executed reasonably well, without stretching size or forcing targets.

What stood out most was not the PnL, but how repeatable those sessions felt. The process was clearer, entries were more selective, and exits were more disciplined.

When I slow down, the edge shows up.

A Few Honest Observations

One ongoing issue is trade volume.

On several green days I exceeded my own five trades per day rule. It worked out this time, but that does not make it good behaviour. The data suggests my best days tend to come from fewer, higher-quality trades rather than maximum participation.

Another clear pattern is how losses cluster. The worst red days tend to follow periods of over-engagement, often driven by trying to make something back within the same session.

Again, this is behavioural, not technical.

Common Misreads of the Dollar View

A few things are worth addressing directly.

This was not a straight line up.
The dollar results reflect both good weeks and difficult ones.

The strong days did not come from oversized risk.
Position sizing stayed consistent. The gains came from execution, not leverage.

The red weeks were not failures.
They were part of the learning curve, and they exposed issues that are now being addressed.

If anything, the dollar view reinforces why discipline matters. Behaviour shows up very quickly when the numbers are real.

What This Month Reinforced

This first month made a few things very clear.

  • Journalling improves execution.
  • Slowing down improves win rate.
  • Drawdowns are usually behavioural.
  • Consistency comes from repetition, not intensity.

None of that is exciting. All of it matters.

Why I’m Sharing This

I’m sharing these posts partly for accountability, but also because trading often lacks transparency.

Most people only ever see the best days or the biggest months. Real progress looks different. It includes red weeks, missed sessions, rule breaks, and gradual improvement rather than sudden breakthroughs.

If this series shows anything over time, I hope it is that progress is possible without hype, without shortcuts, and without pretending the hard parts do not exist.

This was Month 1.

On to the next, with fewer trades, better notes, and more patience.