Tag Archive for: R Value

You close the platform, glance at the day’s P&L, and it’s red. Not a blow-up day, just red. The annoying part is you didn’t trade badly. You actually had more wins than losses. You followed the plan. On paper it was a good day.  So what gives?

So why did your account go backwards?

I’ve had days exactly like that. The trades were fine. The sizing wasn’t.

This is the gap between a green day in R and a red day in dollars. It catches a lot of traders out, and once you’ve seen it you can’t unsee it.

R measures your decisions. Dollars measure your consistency. You can read the market well all day and still finish red if your sizing is all over the place.

Thinking in R, not just dollars

Quick definition first. R is just the amount you risk on a single trade. Risk $500 on a position and that $500 is your 1R. A trade that pays twice your risk is +2R. A full loss is -1R. R lets you talk about trades without the account size getting in the way, so a +2R win is a +2R win whether you’re trading $5,000 or $500,000.

Counting your day in R tells you one thing: whether your decisions were any good. Add up the R across every trade, and a positive number means the market paid you for the calls you made.

Dollars tell you something else. They tell you whether your sizing matched those decisions.

Most days the two agree. A green day in R is a green day in dollars. But they only stay in step if every R is worth about the same number of dollars. The moment your sizing drifts, they come apart.

Same trades, two different days

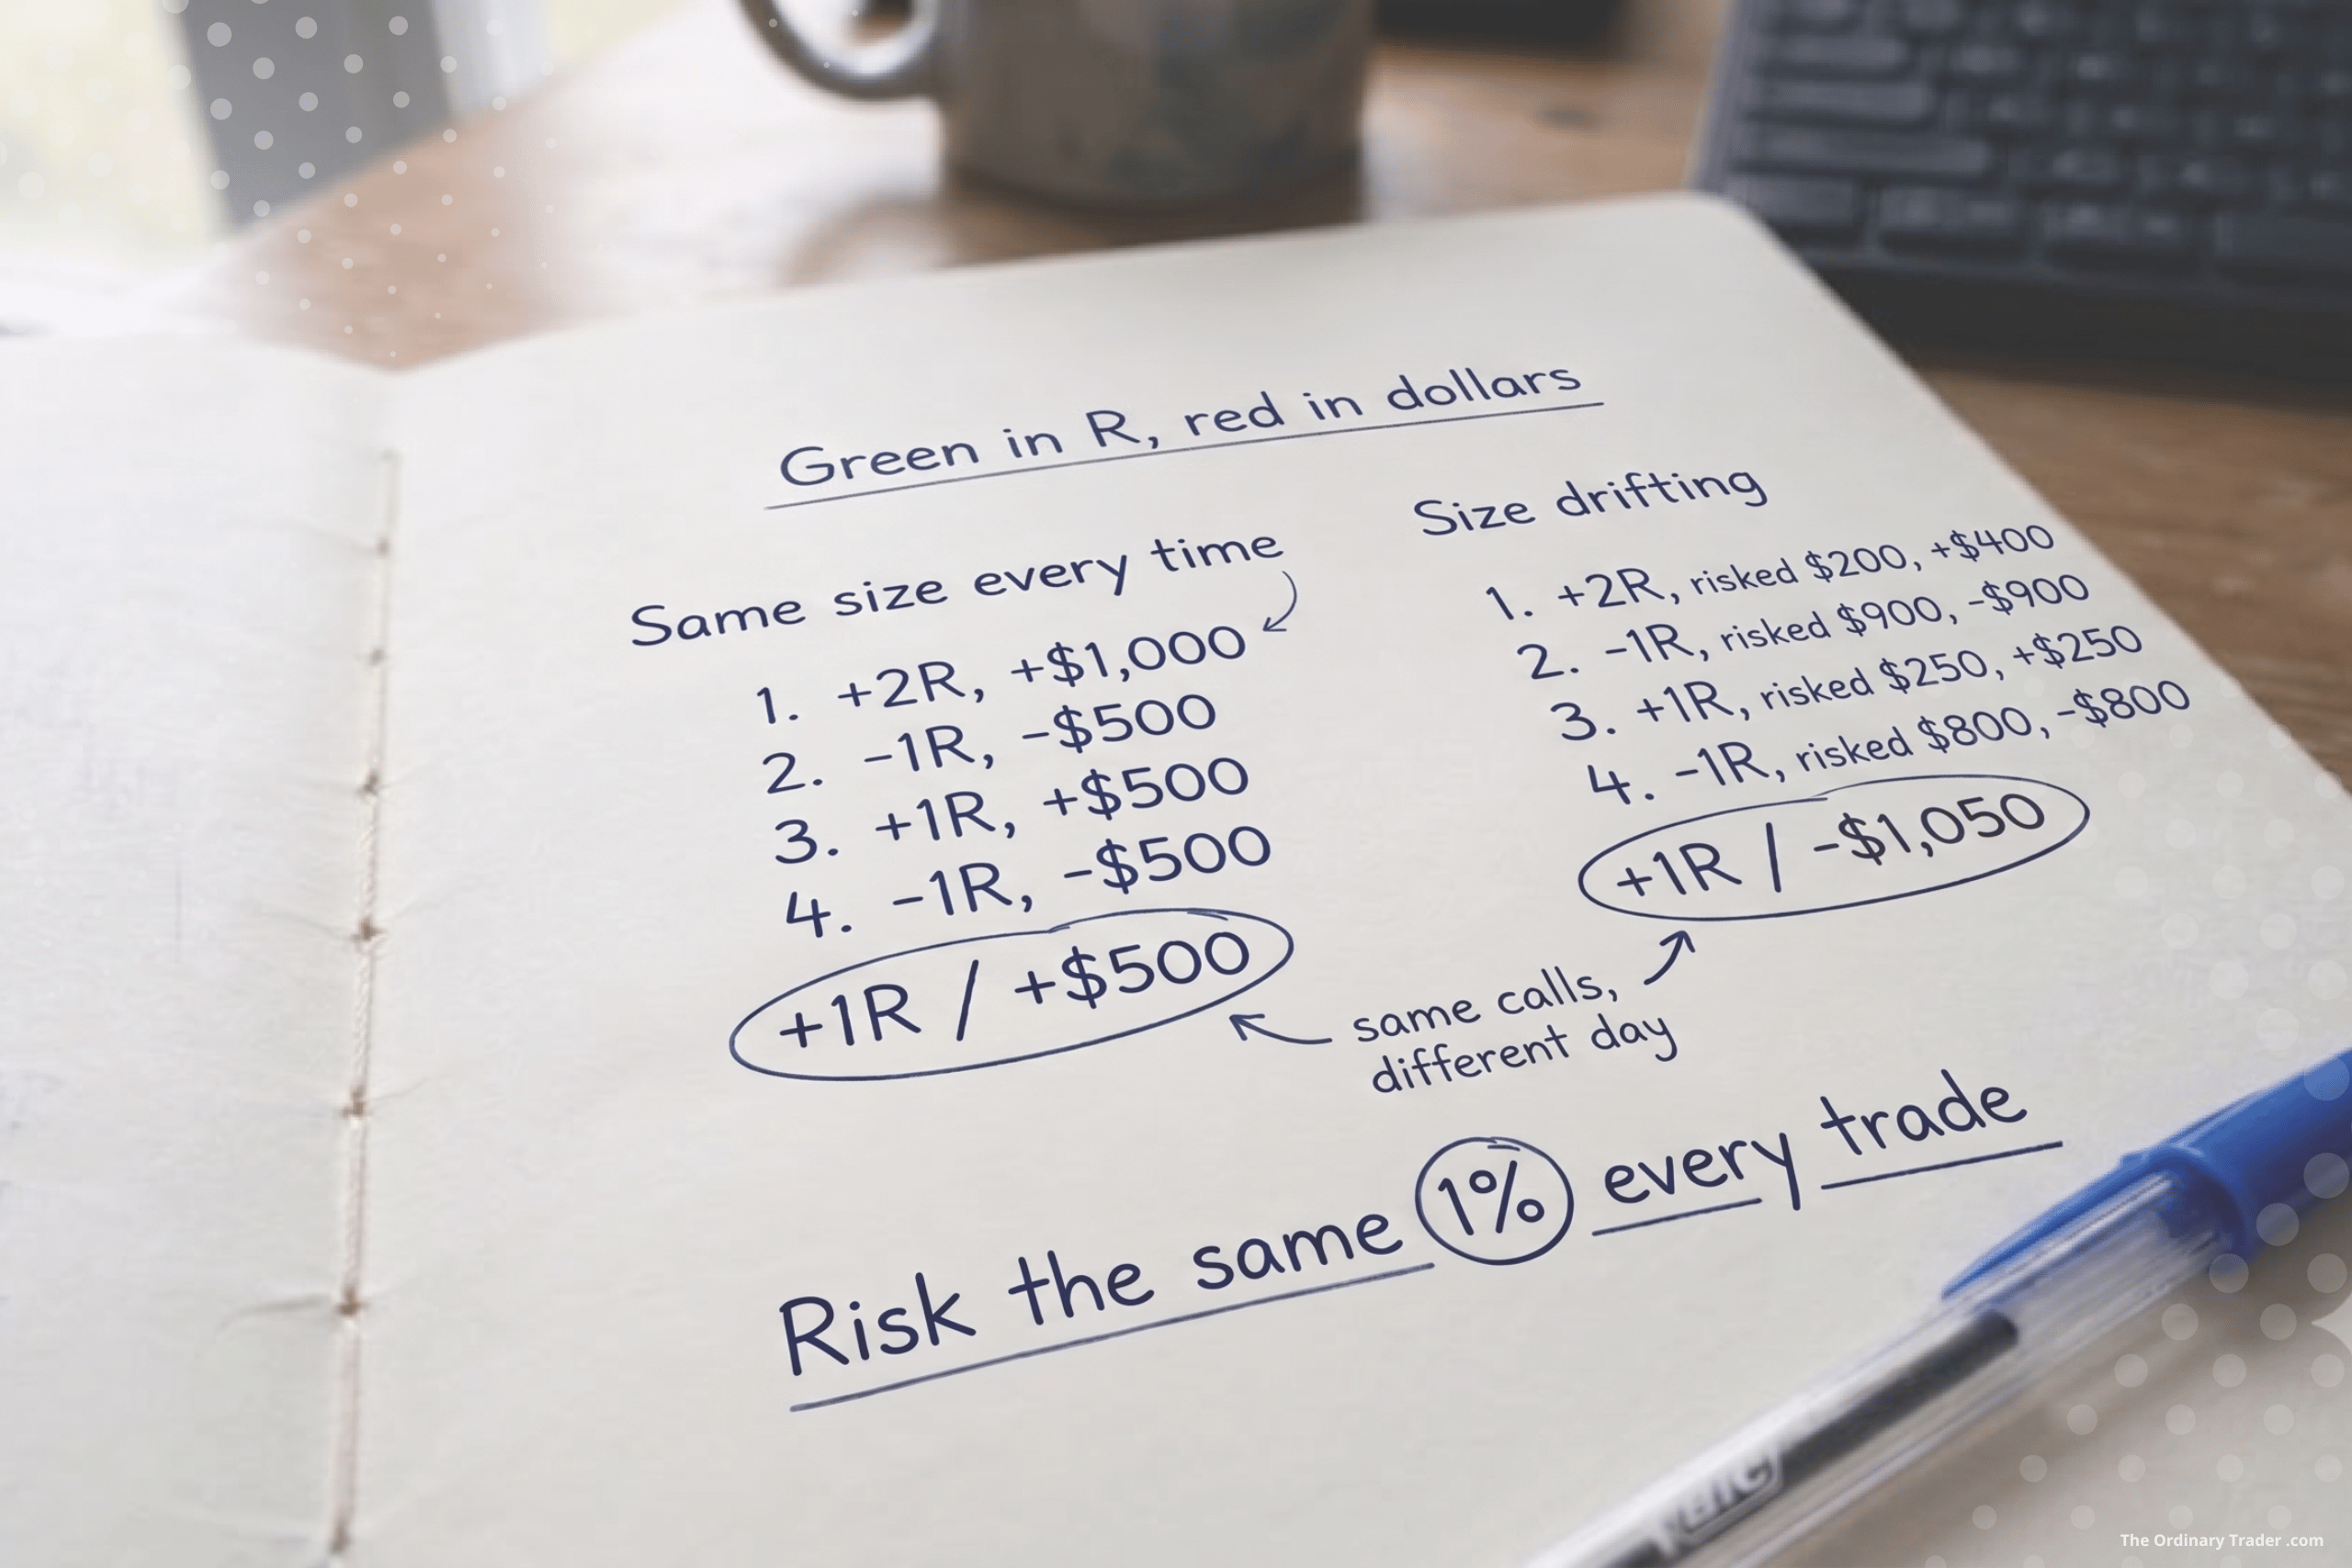
Here’s a simple example. Account of $50,000, risking 1% per trade, so 1R is $500. Four trades on the day.

Sized the same every time, at $500:

  • Trade 1: win, +2R, +$1,000
  • Trade 2: loss, -1R, -$500
  • Trade 3: win, +1R, +$500
  • Trade 4: loss, -1R, -$500

Net R: +1R. Net dollars: +$500. Green in both. Nothing clever happened. The sizing was just consistent.

Now the same four trades, the same R outcomes, but the sizing wandered. The wins landed on setups I was unsure about, so I went in small. The losses landed on the ones that looked obvious, so I went in heavy.

  • Trade 1: win, +2R, risked $200, +$400
  • Trade 2: loss, -1R, risked $900, -$900
  • Trade 3: win, +1R, risked $250, +$250
  • Trade 4: loss, -1R, risked $800, -$800

Net R: still +1R. The decisions were identical. Net dollars: -$1,050.

Red.

Same trades. Same calls. One day green, one day red. The only thing that changed was how much sat on the line each time.

Why sizing drifts without you noticing

That second day isn’t a freak event. It’s the pattern most of us fall into the moment we stop sizing by rule.

The setups that feel obvious tempt you to size up. They look like free money, so why not press? The trouble is the market doesn’t know which of your trades felt obvious. Some of those sure things lose, and now your biggest position is also your biggest loss.

The setups you’re unsure about tempt you to size down. Then it runs clean to target and you’ve collected a fraction of what the call was worth.

Yesterday leaks in too. After a win, confidence is up and the next position quietly creeps larger. I had this on a crude oil trade not long ago. An early win in the session made it far too easy to assume the next long would behave the same way. After a loss, the opposite happens and you shrink.

None of this is a decision you make on purpose. That’s what makes it dangerous. The R stays honest. The dollars quietly betray you.

Risk the same amount every time

The fix is boring, which is rather the point.

Risk the same percentage on every trade. I aim for 1% of my balance, every time, no matter how good the setup looks. The whole idea of an edge is that you’re right more often than you’re wrong across a large number of trades. You don’t know in advance which individual trade will be the winner. So betting more on the ones that feel good is just guessing, dressed up as conviction.

Fix the percentage and the dollars line up with the R. A green day in R becomes a green day in dollars, because that’s how the maths works when every R is the same size.

When one contract is too much

There’s a practical snag. Futures contracts come in fixed sizes, and sometimes one contract already risks more than 1%.

Take crude oil. One standard contract (CL) moves $10 a tick. The micro version (MCL) is a tenth of that, $1 a tick. Say your stop is 20 ticks and your 1% is $500.

With the standard contract, one CL risks $200 over that stop. To hit $500 you’d need 2.5 contracts, and you can’t trade half a contract. So you round to two ($400, or 0.8%) or three ($600, or 1.2%). Either way you’ve missed your number.

With micros, one MCL risks $20 over the same stop. $500 divided by $20 is exactly 25 micros. You land on 1% precisely.

That’s the case for dropping down to micros. Not because they’re safer, but because they let you size accurately when the bigger contract is too blunt an instrument. Most index futures work the same way, with a full contract and a micro at a tenth of the size.

Let the journal catch it

You log every session anyway. Add one column. Track the R and the dollars side by side, day by day.

Most days they’ll agree. The day you want to notice is the one where the R is green and the dollars are red. One of those is noise. A run of them is a message, and the message is that your sizing is the leak, not your strategy.

That matters because the instinct when the account bleeds is to go hunting for a better setup. But if the R is positive, the setups are doing their job. The thing to audit is how much you put on each one.

A note for funded traders

If you’re trading a prop firm evaluation, this stops being just an annoyance. A lot of firms run consistency rules, a cap on how much any single day or trade can contribute to your total profit. Size all over the place and one oversized winner can breach that limit, failing the challenge even on a profitable run. Same fix as always. Risk the same amount every time.

The quiet discipline

R measures your decisions. Dollars measure your consistency. You can read the market well all day and still finish red if your sizing is all over the place.

Sizing isn’t the exciting part of trading. It’s not a setup or an entry. It’s the bit that runs underneath, deciding whether your good decisions actually show up in the account. Get it consistent and the green days in R start turning into green days in dollars, which is the only place the difference ever really shows.

Should You Take 1R or Let It Run?

Most new traders focus almost entirely on entries. They refine confirmations, tweak structure rules, and optimise timing. But very quickly you realise something more important. Your exit strategy determines your expectancy.

Let’s walk through a clean example using simple numbers. No complicated formulas. Just clear logic.

We will assume the same core distribution throughout so every strategy is compared fairly.

The Starting Distribution

Across a large sample of trades:

  • 40% lose and hit full stop at -1R
  • 30% reach 1R but fail to extend further
  • 30% extend beyond 1R and can reach 1.5R

This is the raw behaviour of your system before deciding how to exit.

Now let’s compare four exit strategies using this same base data.

Strategy 1: Fixed 1R Take Profit

In this model you close the entire position at 1R. No partials. No trailing. No runners.

Using the base distribution:

  • 60% of trades reach at least 1R
  • 40% lose -1R

So expectancy is:

  • 60% × +1R = +0.60R
  • 40% × -1R = -0.40R

Total = +0.20R per trade

This is clean and efficient. Your edge here is accuracy. You monetise the fact that most trades reach 1R.

Strategy 2: 50% Partial at 1R, Runner to 1.5R

This is the classic hybrid approach.

When price hits 1R:

  • Close 50% for +0.5R
  • Move stop to break even

If the trade extends to 1.5R:

  • Remaining half earns +0.75R
  • Total win = +1.25R

If price reverses after 1R:

  • Remaining half stops at break even
  • Total win = +0.5R

Using our distribution:

  • 30% hit 1.5R → +1.25R
  • 30% stall after 1R → +0.5R
  • 40% lose → -1R

Now calculate:

  • 30% × 1.25R = +0.375R
  • 30% × 0.5R = +0.15R
  • 40% × -1R = -0.40R

Total = +0.125R per trade

Still profitable. But lower than the simple 1R model.

Why? Because only 30% of trades meaningfully extend. The runner frequency is not high enough to compensate for halving position size.

Strategy 3: Full Position Runner to 1.5R

Now we remove partials. The entire position aims for 1.5R.

If price reaches 1R but fails to continue, you move stop to break even and make nothing.

Distribution becomes:

  • 30% hit 1.5R → +1.5R
  • 30% reach 1R but reverse → 0R
  • 40% lose → -1R

Expectancy:

  • 30% × 1.5R = +0.45R
  • 30% × 0R = 0
  • 40% × -1R = -0.40R

Total = +0.05R per trade

You increased reward size but reduced realised wins. That trade off reduced expectancy.

Strategy 4: Structure Based Trailing

Now we remove the artificial 1.5R cap. Instead of targeting a fixed multiple, you trail behind structure and allow the market to decide.

To keep assumptions realistic, let’s use this distribution:

  • 40% lose → -1R
  • 30% reach 1R and then stop at break even → 0R
  • 20% trend moderately → +1.5R
  • 10% become strong runners → +2.5R

Now calculate:

  • 20% × 1.5R = +0.30R
  • 10% × 2.5R = +0.25R
  • 30% × 0R = 0
  • 40% × -1R = -0.40R

Total = +0.15R per trade

This improves on partials and fixed 1.5R runners, but still does not beat the simple 1R model under these conditions.

Comparing All Four

Using consistent assumptions:

  • Fixed 1R → +0.20R
  • Partials + 1.5R cap → +0.125R
  • Full 1.5R runner → +0.05R
  • Structure trailing → +0.15R

Under this distribution, the simplest strategy wins.

What This Teaches a New Trader

Risk reward ratio alone means nothing. A 1:1.5 target is not automatically superior to 1:1. What matters is how often price actually extends.

Your optimal exit depends on the behaviour of your market.

In rotational conditions:

  • Moves stall quickly
  • Pullbacks are deep
  • Extensions are limited

That profile favours harvesting 1R consistently.

In strong trending conditions:

  • Pullbacks are shallow
  • Structure stair steps cleanly
  • Large extensions are common

That profile favours structure based trailing and uncapped runners.

The mistake is using the same exit logic in both environments.

How to Decide With Data

Track one simple metric over your next 50 trades:

Maximum favourable excursion measured in R.

If most trades rarely exceed 1.5R before reversing, fixed 1R exits are likely optimal.

If a meaningful percentage regularly reach 2R or more, you may be capping your distribution too early.

The goal is not to maximise reward on a single trade. The goal is to optimise your overall distribution.

Sometimes the ordinary 1R is the most efficient solution.

Sometimes the market is offering a trend and you need to step aside and let it pay you.

The numbers will tell you which environment you are in.