Tag Archive for: Exit Strategy

Two traders take the same course. Same rules, same instrument, same hours at the screen. Six months later one is flat and the other is down 30%.

The easy conclusion is that the strategy failed for one of them. It didn’t. They were never running the same strategy. They were running the same document.

A written strategy is a set of instructions. An executed strategy is what actually happened at the desk. Nearly all of the difference lives in the gap between them, and most traders never look, because they only ever examine the document.

Here is what really differs, in rough order of damage.

Two traders splitting their trading hours differently but using the same strategy are testing different things, then comparing results as if they were one.

The signals you skip are a strategy decision

Any strategy worth following produces more valid signals than one person will take. You are asleep, at work, or unconvinced. So you filter. Everybody filters.

The question is what your filter selects for.

One trader takes the clean setups and passes on the marginal ones. The level is obvious, the entry sits where the plan says it should. Dull. Dull is the point.

The other passes on the clean ones because they look slow, and takes the marginal ones because something is happening. Faster candles. A level that nearly holds. A move already underway.

Neither has broken a rule. Both would say they follow the strategy. But hand their filled orders to a stranger and they would be read as two different methods. One is taking a subset with better than average characteristics. The other is taking a subset selected for excitement.

Selection is the largest single variable, and it is invisible, because nobody logs the trades they didn’t take.

Size changes who you are by week three

Same rules, different risk per trade. Two $50,000 accounts. One trader risks 1%, or $500. The other risks 3%, or $1,500.

Now run six losses in a row, which any honest strategy hands you eventually. The first trader is down about 5.9%. Uncomfortable. The second is down about 16.7%. That isn’t uncomfortable, that is a different emotional state.

And it feeds back. The trader down 16.7% hesitates on the next valid signal, or sizes up to make it back. By week three they are not the trader who wrote the rules. Their sizing has quietly rewritten their selection and their exits.

Risk per trade gets discussed as an arithmetic question. It is a psychology question wearing an arithmetic costume.

The same setup at a different hour is a different setup

Volatility, volume and who is in the market change through the day. A setup taken in the first thirty minutes of the US session and the same setup taken in a quiet midday drift share a shape and little else.

Two traders splitting their trading hours differently but using the same strategy are testing different things, then comparing results as if they were one.

Taking +1R when the plan says +3R

Say the strategy wins 40% of the time and targets +3R. Over a hundred trades: 40 wins at 3R, 60 losses at 1R. That is 120R less 60R: +60R, or +0.6R per trade.

Now exit early. You take +1R when the trade stalls and the screen gets uncomfortable. Your win rate rises, because more trades reach +1R than reach +3R. Say it rises to 55%. That is 55 wins at 1R against 45 losses at 1R: +10R over a hundred trades, or +0.10R each.

Same entries. Same losses. A sixth of the return.

To get back to +0.6R while exiting at +1R, that trader would need to win 80% of the time, and nothing about their entry produces 80%. They have moved themselves to a point on the win rate and risk-reward curve their method cannot support, one sensible-feeling decision at a time.

A strategy followed 80% of the time is a different strategy

Fifty trades is a sequence, not just a sample

Two people run the same positive expectancy strategy for fifty trades. Same edge. Different order.

At a 40% win rate, six losses in a row has a probability of about 4.7% from any given starting point, so across fifty trades you should expect one. Whether it lands at trades 1 to 6 or trades 31 to 36 is luck.

The one who meets it first rarely reaches trade fifty. They adjust something at trade nine, and again at trade seventeen. By trade fifty they have run four strategies for twelve trades each and learnt nothing dependable about any of them.

A strategy followed 80% of the time is a different strategy

The 20% you deviate on is not a rounding error. It is a second, unnamed strategy with unknown properties, and its trades sit in the same account, so your results describe a blend you have never written down and cannot test.

None of this is a story about discipline as a personality trait. Some people are steadier than others, but that is not the useful part. The gap between the written strategy and the executed one can be measured, and measuring it doesn’t need a change of character. It needs a record.

What to log for the next two weeks

Every valid signal the strategy produced. Not just the ones you took.

Four fields for each:

  • Taken or skipped
  • If skipped, the reason, written at the time
  • Session and time of day
  • Risk taken, and where you exited versus the plan

By the end you will have two strategies on paper: the one in your Playbook, and the one you ran. Read the skip reasons together and the filter you didn’t know you had becomes obvious. Read the exits together and you will see your real risk-reward.

That log is the difference between the two traders, written down.

Most study time goes on the smaller half of the problem. Another confirmation tool, a tighter entry, a different instrument. The executed version, the one with the skipped signals and the early exits, is the version you are being paid or charged for.

Write both down. Then you can compare them.
Where most people put their stop

Watch how a lot of traders set a stop and you will see the same move. They decide how much they are willing to lose, or how many points feels tolerable, and they put the stop there. Ten points because ten points feels okay. A round number because round numbers feel tidy. A fixed distance because that is what they always use.

The problem is that none of those reasons have anything to do with the trade. The market does not know or care how much you can afford to lose. It moves according to structure, liquidity, and where other people’s orders sit, and your comfort level is not on the chart. A stop placed to protect your feelings will sit in the wrong place almost every time, and the wrong place is where you get taken out of trades that were actually fine.

The market does not know or care how much you can afford to lose.

A stop answers one question

The real job of a stop is to answer a single question: at what point is my reason for being in this trade wrong?  Or to put it another way, at what point is my trade idea invalidated?

You entered for a reason. The market broke structure in your direction. Price tapped a Point of Interest and reacted. A level held. Whatever it was, there is a point on the chart where that reason no longer holds, where the story you entered on has clearly failed. That point is where your stop belongs, because that is where the trade is genuinely invalidated.

If you are long because a swing low held and the market broke upward, then a decisive move back below that low says the idea was wrong. The stop goes just beyond that low. Not at a round number nearby, not at the distance that feels comfortable, but at the level that, if hit, tells you honestly that this trade is done. When the stop marks invalidation, getting stopped out stops feeling like a personal failure and starts being useful information: the setup did not work, and you are out for a good reason.

Give the level room to breathe

Placing the stop on structure is the idea. Placing it too tight against the exact level is the common mistake.

Price does not respect levels to the tick. It overshoots. It wicks through a low, grabs the orders sitting just underneath, and reverses. That move even has a name in the method: a Liquidity Sweep. The stops resting exactly on the obvious level are the fuel for it. If your stop is sitting right on the round number or a hair below the swing low, you are parked in the most crowded spot on the chart, and you will get swept out of trades that then go on to work without you.

So the stop goes beyond the level, with enough room that a normal sweep does not take you out but a real break does. This is a judgement call, not a formula, and it is worth studying on your own charts: how far does price typically poke past a level before it means something. Give the trade room to survive the noise, while still cutting it the moment the structure genuinely breaks.

Set the stop where the idea dies. Give it room to survive the noise.

Now, and only now, size the trade

Here is the part that ties it together, and the reason the order matters so much. Once the stop is placed where the chart says it belongs, you have a fixed distance from entry to stop. That distance decides your size, not the other way round.

If the stop is far away, you take fewer contracts. If it is close, you can take more. What stays constant is the amount you are risking, whether you think of that as a flat dollar figure or 1R. The stop is set by the market. The size is the dial you turn to keep your risk where you want it.

This is the inversion most people never make. They pick a size they like and then hunt for a stop distance that fits it, which means jamming the stop somewhere that suits the position instead of the chart. Do it the other way. Find where the trade is wrong, put the stop just beyond it, then let that distance tell you how big you are allowed to be. If the resulting size feels too small, the honest answer is usually that the trade needs a wide stop and your risk cannot support a bigger position. That is the trade telling you the truth, and the fix is to take fewer contracts, never to move the stop in.

Why this is worth the discipline

A stop set on structure and sized to properly does two things at once. It gets you out of trades that are genuinely broken, at the point where staying in is just hope. And it keeps you in trades that are merely being noisy, because you gave the level enough room to breathe and sized so that the wider stop was still affordable.

The tight, comfortable, round-number stop does the opposite of both. It keeps you in busted trades because the level you cared about is already gone, and it throws you out of good ones because you parked right where the sweep was always going to run.

Set the stop where the idea dies. Give it room to survive the noise. Then size the trade to fit. Do it in that order and the stop stops being the thing you dread and becomes what it was always meant to be: the line that tells you, cleanly, when you are wrong.

You placed your final take profit at a level that made sense. A structural high, a measured target, a clean R-multiple. You had a reason for it.

Then the trade went your way. It moved, it built, it looked exactly like it was supposed to. And you closed the whole position. Not a partial — everything. You told yourself it was the right call, that locking in the gain was disciplined, that you were protecting the account.

Then you watched the trade carry on and hit your original target anyway.

This is not a discipline problem. It is not even really a psychology problem. It is a sizing problem, working in reverse.

The same issue as position sizing, wearing a different mask

Last week’s post was about what happens when your position is too large going into a trade. The nerves. The inability to hold a stop calmly. The way a losing trade feels catastrophic when the size is wrong.

The same mechanic applies on the way up.

When your position is oversized, you do not just feel the losses more intensely. You feel the gains more intensely too. A trade that is running in your favour starts to show you a number in green that feels real and meaningful and, critically, fragile. The thought arrives quietly: what if it turns? What if I give all of this back?

So you close it all. You take the full profit early. And you call it sensible.

The trade did not fail. The size made it impossible to sit in.

When your position is oversized, you do not just feel the losses more intensely. You feel the gains more intensely too.

You do not fully trust where your TP is or why

The second reason traders close too early is that they placed a target at a level they do not really believe in.

If you understand market structure, your final TP is at a structural level for a reason. It is where the previous high sits, where liquidity will be drawn, where the market is likely to reach before it decides what to do next. You placed it there because the chart told you to.

But if you placed it there because it looked like a round number, or because someone else suggested it, or because it was “about right,” you will not trust it when the trade is mid-run. The doubt arrives the moment the price pauses or consolidates, and the easiest way to resolve doubt is to exit.

Understanding why your target is where it is makes it much easier to stay in the trade long enough to hit it. The structure holds the stop in place. It holds the target in place too.

Markets move in waves. Pullbacks are not reversals.

Price does not go from your entry to your final TP in a straight line. It pushes, pulls back, consolidates, and then continues. This is normal. It is how markets move.

But when you are watching a trade tick by tick, a pullback mid-run feels like the trade is breaking. You were up a meaningful amount. Now that number is smaller. The instinct is to protect what is left before it disappears entirely.

Most of the time, what you are watching is just the trade breathing. The structure is still intact. The original reason for the trade is still valid. The pullback is not an exit signal. It is the market doing what it always does before continuing.

Stepping away from the screen during a live trade is one of the most underrated skills in trading. The trader who is not watching every tick is usually the one who is still in the trade when the final TP hits.

The part that actually helps: partials and break even

Taking some profit off the table is not the same as closing the whole trade early.

If you have sized correctly and the trade is moving your way, taking a partial at an intermediate level changes the emotional equation. You have locked in something real. The remaining position is now smaller. And if you move your stop to break even at the same time, what is left cannot lose.

That combination – a partial taken at a reasonable point and a stop moved to entry – gives you a guaranteed outcome on the trade. You have already won something. What is left can run to the final TP without the same weight of anxiety sitting on it.

This is not the same as closing everything early. It is managing the trade in a way that lets you hold the rest of it calmly.

The pullback is not an exit signal. It is the market doing what it always does before continuing.

The calculation came before the emotions

Your final take profit was set before the trade opened. You looked at the chart with no position on, no money at risk, no emotional stake in the outcome. You found the level that made sense.

Then the trade opened, money went on the line, and the feelings arrived. The number in green started talking.

The decision to close everything early is made by someone who is inside the trade, watching every tick, feeling the weight of potential loss on a gain that has not yet been secured. The original TP was set by someone who was none of those things.

When those two decisions conflict, trust the one that was made from the outside.

I’m not talking about your daily target, or the line you draw in your trading plan before the session starts. I have those too. Mine is 2% a day, with a soft trigger at 80% that asks me whether I’d rather lock it in and walk.

That question is easy compared to the one I actually want to talk about.

The one that gets asked mid-trade.

The moment

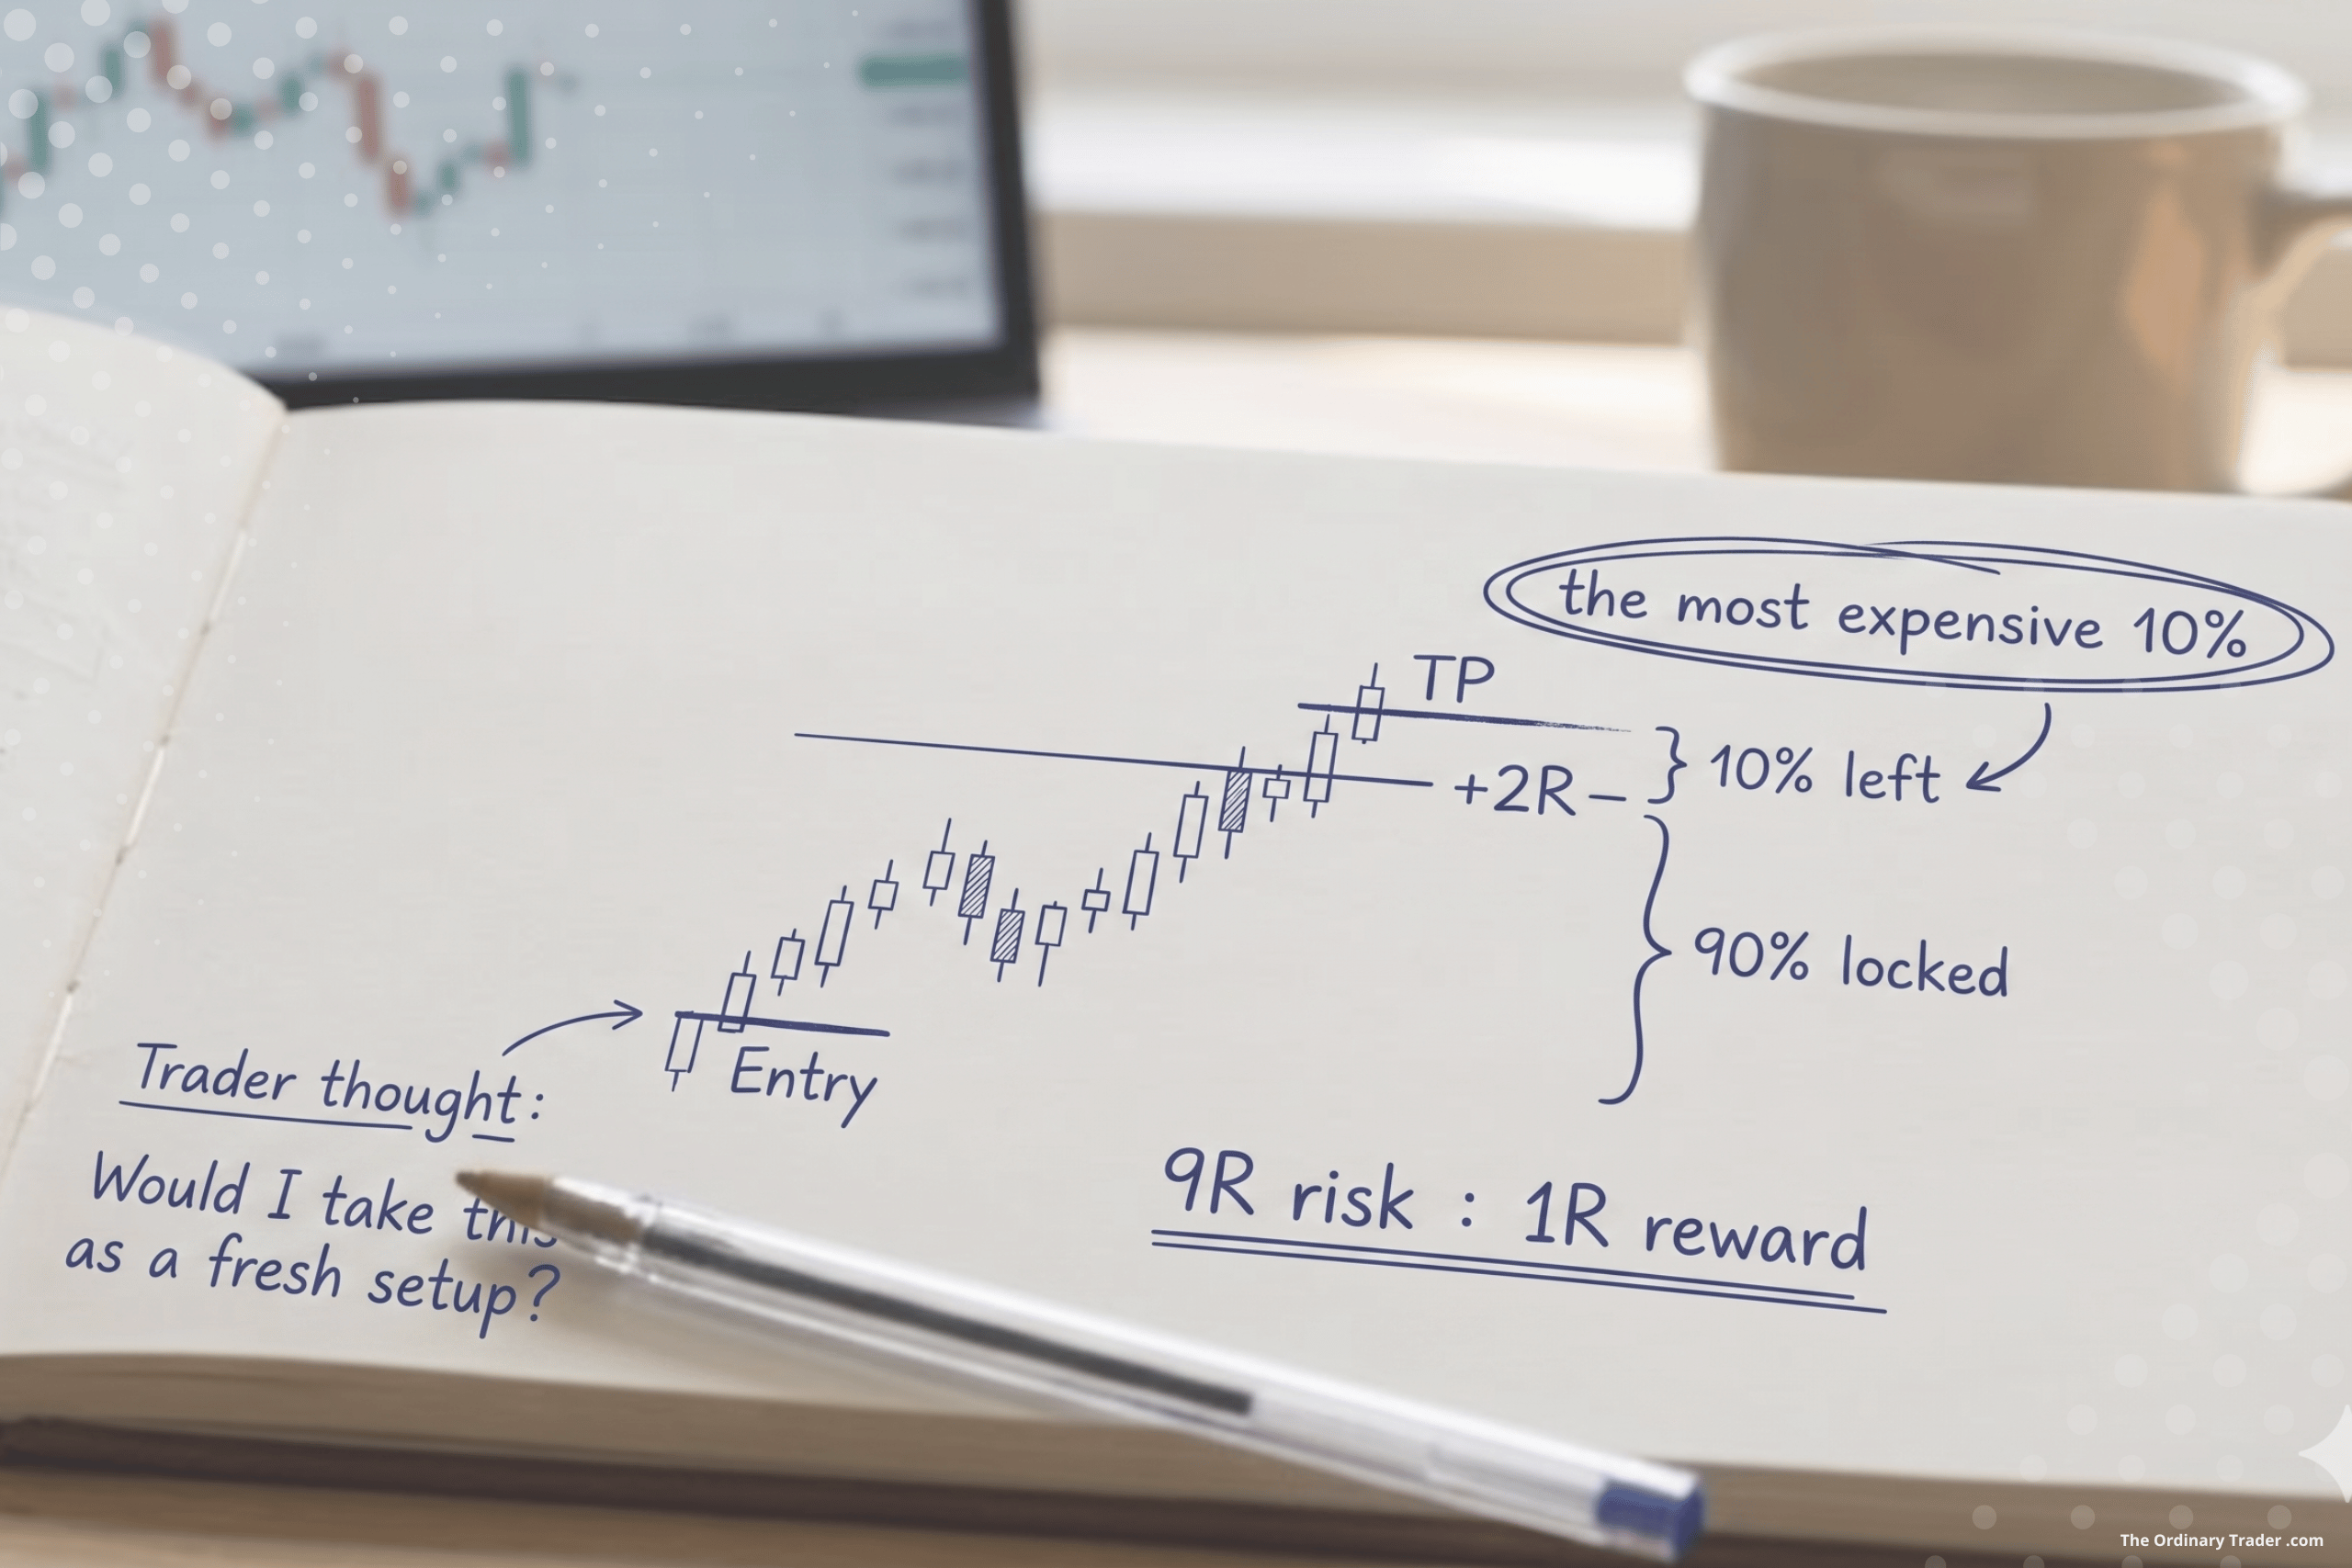
You’re in. Stop placed, target set, risk defined. The trade moves. Then it really moves. Suddenly you’re +2R. The candles are doing what you said they would do. You’re 90% of the way to TP and the only thing left is the final push over the line.

You wait for it.

And then, without warning, the market swings violently back the other way. Not all the way to your stop. Just enough to give back most of what was on the table. By the time you’ve registered what happened, you’re closer to break even than to your target.

Now you’ve got nothing to do but sit there and ask yourself the question you should have asked five candles ago.

When you’re 90% of the way to your TP, the last 10% is the most expensive bit of the trade.

We treat the target as a finish line

This is the trap. The plan said TP at this level. So anything short of it feels like quitting early. Like cheating ourselves. Like the version of us that took +1R last week and then watched the trade run for another 3R is going to show up and tut.

But the target was never a finish line. It was a hypothesis. A best guess at where price might go if the structure played out the way we read it. The market hasn’t read the plan. It doesn’t owe us the last 10%.

We know this. We say it back to ourselves all the time. Then we hold anyway.

The most expensive 10% in trading

Here’s the maths that always feels uncomfortable.

When you’re 90% of the way to your TP, the last 10% is the most expensive bit of the trade. You’re risking 90% of locked profit to capture another 10% of move. The reward-to-risk inside that final stretch is upside down. You wouldn’t take that as a fresh setup. You’d never enter a trade with 9R of risk for 1R of upside.

But because you’re already in, and because the profit feels like it isn’t yours yet, you accept the trade-off without noticing you’ve taken it.

That’s the part we miss. We tell ourselves we’re being patient. We’re actually taking a brand new, badly priced trade on top of the one we already won.

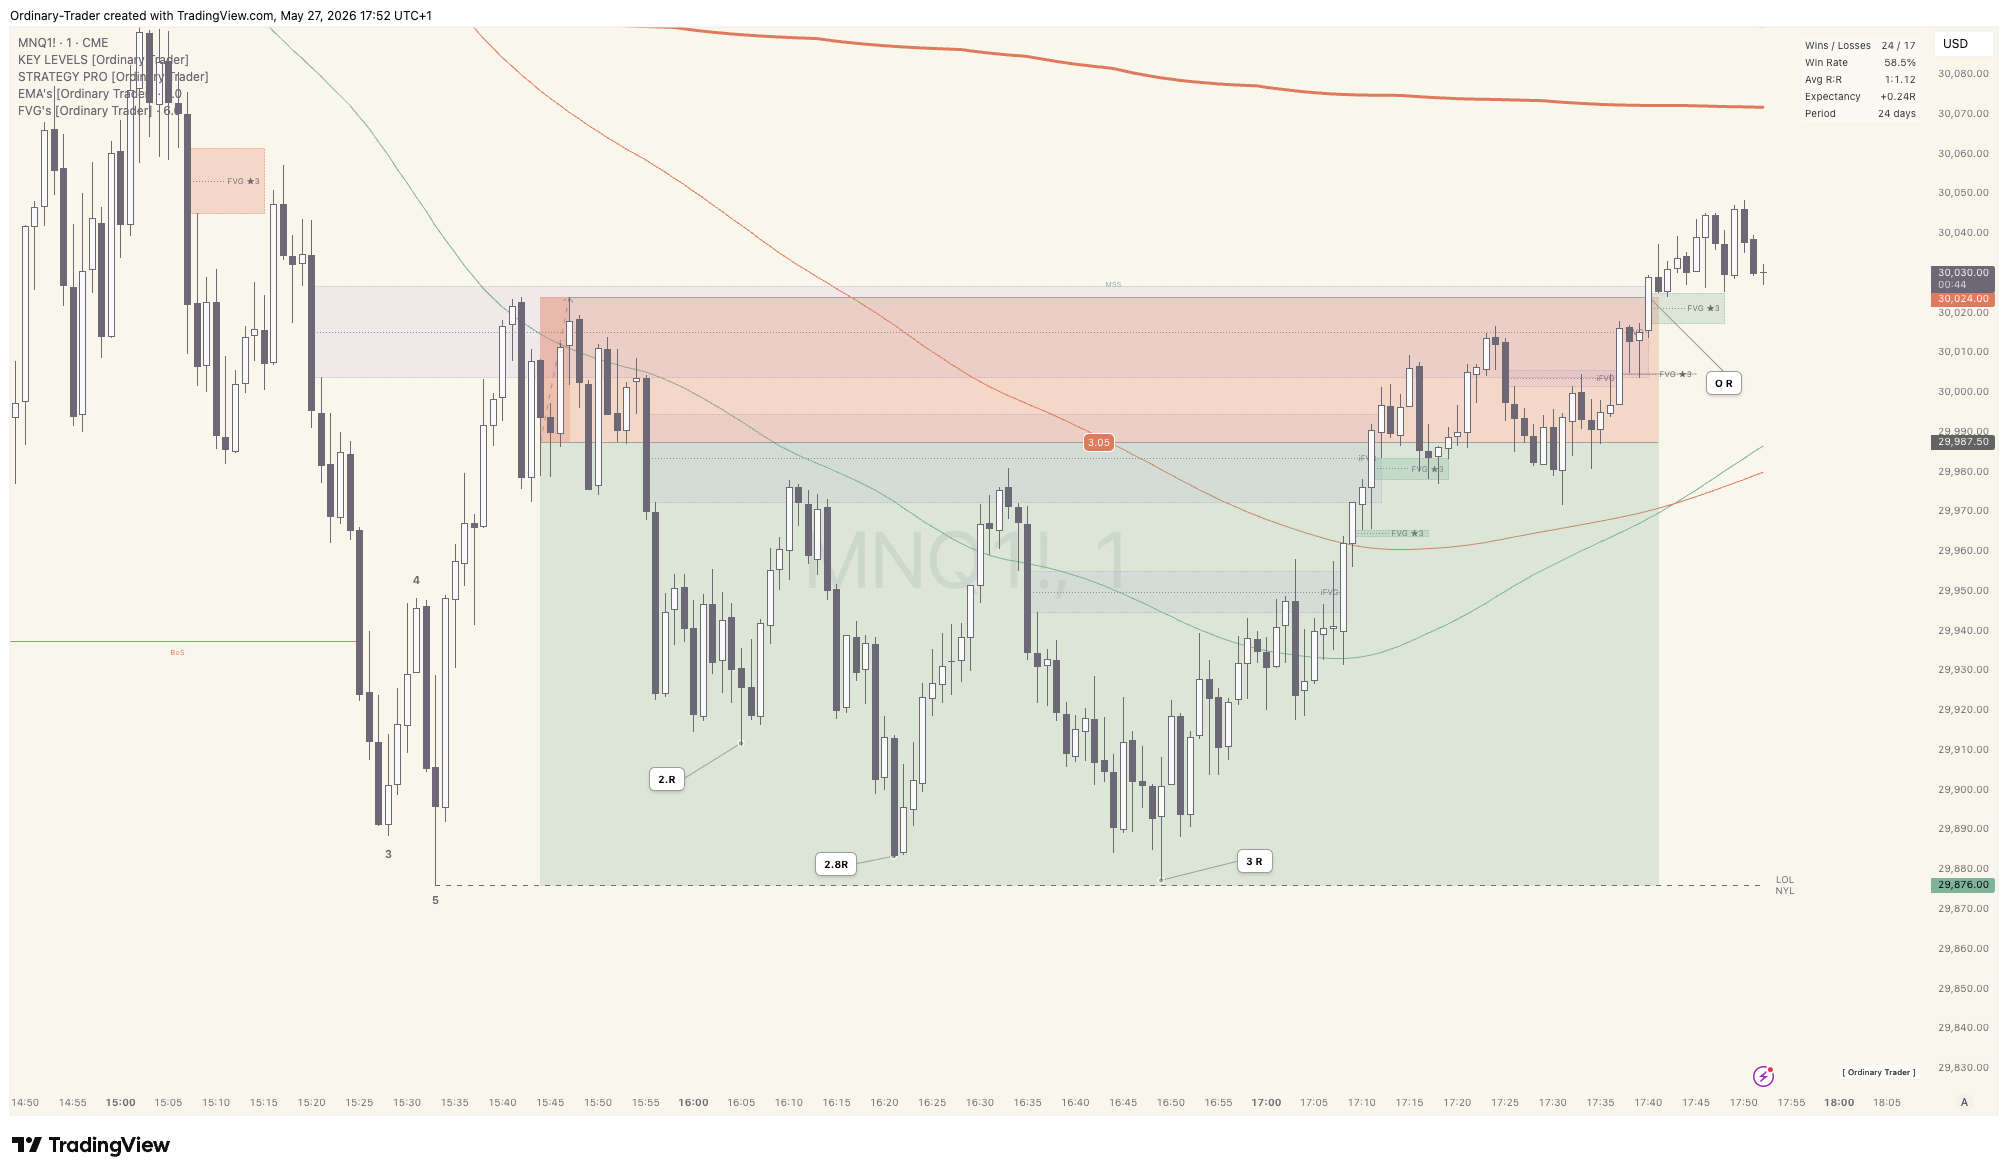
3 Opportunities to take profit before getting stopped out.

Base hits add up

There’s an idea trading culture borrows from elsewhere. That every entry has to be the big one. The full extension. The screenshot trade. The home run that makes the week.

It doesn’t.

A run of clean base hits at +1R, +1.2R, +0.8R is a perfectly good week. It’s a great year. Most of the equity curves I respect were built on base hits, not on the chase for the occasional 5R that gets posted.

Taking the partial isn’t selling yourself short. It’s collecting on the work the trade has already done. The next one is allowed to be ordinary too.

Some exits are mapped before the trade starts

A lot of this work happens before the trade is even live.

If you’ve done the Path to Profit work, you already know what sits between your entry and your target. The FVGs that might cause a stall. The opposing liquidity sitting just before TP. The big opposing candles where prior intent is still visible.

Those aren’t just risks. They’re also the most honest places to take something off. A partial at the FVG. A move to break even before the opposing liquidity. A full exit when the path beyond looks crowded.

The decision is always calmer when the chart is.

Trailing helps, when it can

The honest answer is that trailing the stop is what we should be doing. Locking in some of the move as structure gives us room to. Moving to break even when the trade clears the first leg. Tucking the stop behind a new swing low when one forms.

This works. Some of the time.

The rest of the time, structure doesn’t give us anything to trail to. The leg is too clean, the move is too vertical, the next swing point is further behind than we’d ever want our stop. Trailing in that situation either gives back all the profit or sits in a place that does nothing useful.

In those trades, the trail isn’t an answer. It’s just a comfort blanket that hasn’t been put to work yet.

The question we’re actually avoiding

What we don’t ask ourselves, in that moment when we’re +2R and the candle is looking heavy, is the only question that matters.

What does this trade still owe me?

Not what’s on the chart. Not what the plan said. Not what the screenshot of the winning version would look like if it played out perfectly.

What does it still owe me, from here, with the information I now have?

Sometimes the answer is real. Structure is building, momentum hasn’t broken, the next level is right there. Hold.

Other times the answer is uncomfortable. The move has already happened. The candles are smaller and rounder. There’s no obvious reason for the next leg. Price has done what we asked of it, and we are now just hoping.

The trade doesn’t owe us anything else. We are the ones still asking.


Sitting with it

I don’t have a clean rule for this. I’m not sure a clean rule exists.

Some days I take the partial too early and watch the trade run without me. Some days I hold past the point of reason and give it all back. Both feel bad. Neither feels like progress on the day it happens.

What I’m trying to do, slowly, is just notice the moment. The one where I stop watching the trade and start willing it forward. That moment is the answer to the question, even if I don’t always act on it.

Enough profit is enough when the trade has done what I asked it to do, and I’m now asking for more than the chart is willing to give.

I don’t always get that right. I’d rather get it wrong honestly than dress it up as a system.

15th – 21st February

Week 8 felt different.

Not explosive.
Not dramatic.
Just steady.

After the turbulence of previous weeks, the focus coming into this one was simple: tighten execution, reduce noise, and behave like a professional.

The Plan

Going into the week, I set five clear rules:

  • Maximum 5 trades per day. Use the trade planner properly.

  • Only take true A+ zones.

  • Keep risk fixed at 1 percent. No oversizing. If resizing, it must be down, never up.

  • Validate structure on at least one timeframe higher before committing.

  • Reassess trailing stop placement relative to the timeframe of entry.

Nothing new. Nothing revolutionary.
Just better discipline.

The Reality

For the first time in a while, I felt genuine alignment between higher timeframe and lower timeframe structure.

Instead of marking up charts mechanically, I began to see how they overlapped.

A protected low on the higher timeframe could also serve as a shared protected low inside a lower timeframe zone. When those two lined up, the setup carried more weight. More confluence. More confidence.

That shift alone changed the quality of trades I was willing to take.

Fewer Trades, Better Decisions

I did not oversize once this week.

That matters more than it sounds.

Keeping risk fixed at 1 percent created emotional stability. There was no internal pressure to “make it back faster.” No temptation to lean heavier on volatile instruments.

Trade frequency also improved. I passed on many setups that I would have taken a few weeks ago. Patience is starting to feel less like restraint and more like strategy.

Ironically, I also identified multiple setups that went on to be great winners without me.

That is an important lesson.

There is a difference between patience and being too demanding on the pullback. If price does not retrace perfectly into your preferred level, sometimes the market simply moves without you. That is an area to refine moving forward. Not by lowering standards, but by avoiding greed in the entry refinement.

Performance Overview

In R terms, Week 8 closed +8.22R across 5 trading days.

In dollar terms, that translated to approximately +$5.18K.

After a difficult Week 7, that kind of rebound feels significant. Not because of the number itself, but because of how it was achieved.

  • No oversized positions

  • Reduced trade count

  • Better structural alignment

  • Cleaner execution

The process improved first. The results followed.

That is the order it should always be in.

Exit Strategy Experiments

One of the most valuable developments this week has been the start of structured exit testing.

I’ve begun comparing:

  • Fixed 1R

  • Partials

  • 1.5R targets

  • Full runners

  • Trailing scenarios

Instead of guessing, I’m running the data.

The goal is not to find the most exciting outcome.
It is to find the most consistent, repeatable one.

Over time, this testing should remove another layer of emotional decision making. Exits should be predefined, not improvised.

Bonus: A Milestone

Quietly, and slightly unbelievably, I passed three prop firm challenges this week.

Not one.
Not two.
Three.

Current funded capital now sits at $250K.

That is real progress.

It is easy to get distracted by daily PnL swings, but zooming out shows something else entirely. Structure is improving. Risk management is tightening. Emotional reactions are decreasing.

Funding is increasing.

The Bigger Picture

Week 8 was not about chasing big numbers.

It was about:

  • Respecting higher timeframe structure

  • Trusting confluence

  • Keeping risk consistent

  • Letting the edge play out

Ordinary discipline produced extraordinary stability.

And that is the direction this project needs to continue.

Trade well. Stay ordinary.

Should You Take 1R or Let It Run?

Most new traders focus almost entirely on entries. They refine confirmations, tweak structure rules, and optimise timing. But very quickly you realise something more important. Your exit strategy determines your expectancy.

Let’s walk through a clean example using simple numbers. No complicated formulas. Just clear logic.

We will assume the same core distribution throughout so every strategy is compared fairly.

The Starting Distribution

Across a large sample of trades:

  • 40% lose and hit full stop at -1R
  • 30% reach 1R but fail to extend further
  • 30% extend beyond 1R and can reach 1.5R

This is the raw behaviour of your system before deciding how to exit.

Now let’s compare four exit strategies using this same base data.

Strategy 1: Fixed 1R Take Profit

In this model you close the entire position at 1R. No partials. No trailing. No runners.

Using the base distribution:

  • 60% of trades reach at least 1R
  • 40% lose -1R

So expectancy is:

  • 60% × +1R = +0.60R
  • 40% × -1R = -0.40R

Total = +0.20R per trade

This is clean and efficient. Your edge here is accuracy. You monetise the fact that most trades reach 1R.

Strategy 2: 50% Partial at 1R, Runner to 1.5R

This is the classic hybrid approach.

When price hits 1R:

  • Close 50% for +0.5R
  • Move stop to break even

If the trade extends to 1.5R:

  • Remaining half earns +0.75R
  • Total win = +1.25R

If price reverses after 1R:

  • Remaining half stops at break even
  • Total win = +0.5R

Using our distribution:

  • 30% hit 1.5R → +1.25R
  • 30% stall after 1R → +0.5R
  • 40% lose → -1R

Now calculate:

  • 30% × 1.25R = +0.375R
  • 30% × 0.5R = +0.15R
  • 40% × -1R = -0.40R

Total = +0.125R per trade

Still profitable. But lower than the simple 1R model.

Why? Because only 30% of trades meaningfully extend. The runner frequency is not high enough to compensate for halving position size.

Strategy 3: Full Position Runner to 1.5R

Now we remove partials. The entire position aims for 1.5R.

If price reaches 1R but fails to continue, you move stop to break even and make nothing.

Distribution becomes:

  • 30% hit 1.5R → +1.5R
  • 30% reach 1R but reverse → 0R
  • 40% lose → -1R

Expectancy:

  • 30% × 1.5R = +0.45R
  • 30% × 0R = 0
  • 40% × -1R = -0.40R

Total = +0.05R per trade

You increased reward size but reduced realised wins. That trade off reduced expectancy.

Strategy 4: Structure Based Trailing

Now we remove the artificial 1.5R cap. Instead of targeting a fixed multiple, you trail behind structure and allow the market to decide.

To keep assumptions realistic, let’s use this distribution:

  • 40% lose → -1R
  • 30% reach 1R and then stop at break even → 0R
  • 20% trend moderately → +1.5R
  • 10% become strong runners → +2.5R

Now calculate:

  • 20% × 1.5R = +0.30R
  • 10% × 2.5R = +0.25R
  • 30% × 0R = 0
  • 40% × -1R = -0.40R

Total = +0.15R per trade

This improves on partials and fixed 1.5R runners, but still does not beat the simple 1R model under these conditions.

Comparing All Four

Using consistent assumptions:

  • Fixed 1R → +0.20R
  • Partials + 1.5R cap → +0.125R
  • Full 1.5R runner → +0.05R
  • Structure trailing → +0.15R

Under this distribution, the simplest strategy wins.

What This Teaches a New Trader

Risk reward ratio alone means nothing. A 1:1.5 target is not automatically superior to 1:1. What matters is how often price actually extends.

Your optimal exit depends on the behaviour of your market.

In rotational conditions:

  • Moves stall quickly
  • Pullbacks are deep
  • Extensions are limited

That profile favours harvesting 1R consistently.

In strong trending conditions:

  • Pullbacks are shallow
  • Structure stair steps cleanly
  • Large extensions are common

That profile favours structure based trailing and uncapped runners.

The mistake is using the same exit logic in both environments.

How to Decide With Data

Track one simple metric over your next 50 trades:

Maximum favourable excursion measured in R.

If most trades rarely exceed 1.5R before reversing, fixed 1R exits are likely optimal.

If a meaningful percentage regularly reach 2R or more, you may be capping your distribution too early.

The goal is not to maximise reward on a single trade. The goal is to optimise your overall distribution.

Sometimes the ordinary 1R is the most efficient solution.

Sometimes the market is offering a trend and you need to step aside and let it pay you.

The numbers will tell you which environment you are in.