
Tag Archive for: ES

You take a trade. It works. The screen shows +$600 gross. You close, feel good about it, log it in the journal, and move on.

Except you didn’t make $600.

You made closer to $525. The other $75 went to commissions, exchange fees, and clearing costs. Not in some hidden, suspicious way. They were always going to be there. But if you’ve never sat down and worked out what you actually pay per trade, that gap can be a quiet drag on expectancy that doesn’t show up until months later, when you wonder why the numbers don’t quite match what the chart said they should be.

The example below is specific to TradeStation US and MES (the Micro E-mini S&P 500), but the principle applies to any retail broker and any micro futures contract.

What the costs actually are

Three things come out of every futures trade, per contract, per side:

  1. Broker commission. TradeStation’s standard published rate is $1.50 per contract, per side. Entering 20 MES costs $30 in commission. Exiting costs another $30. That’s $60 round trip for commission alone.
  2. Exchange and clearing fees. The CME charges roughly $0.30 to $0.37 per micro contract, per side. On 20 contracts, that’s about another $7 each way.
  3. NFA regulatory fee. Two cents per contract, per side. Small on its own. Adds up at size.

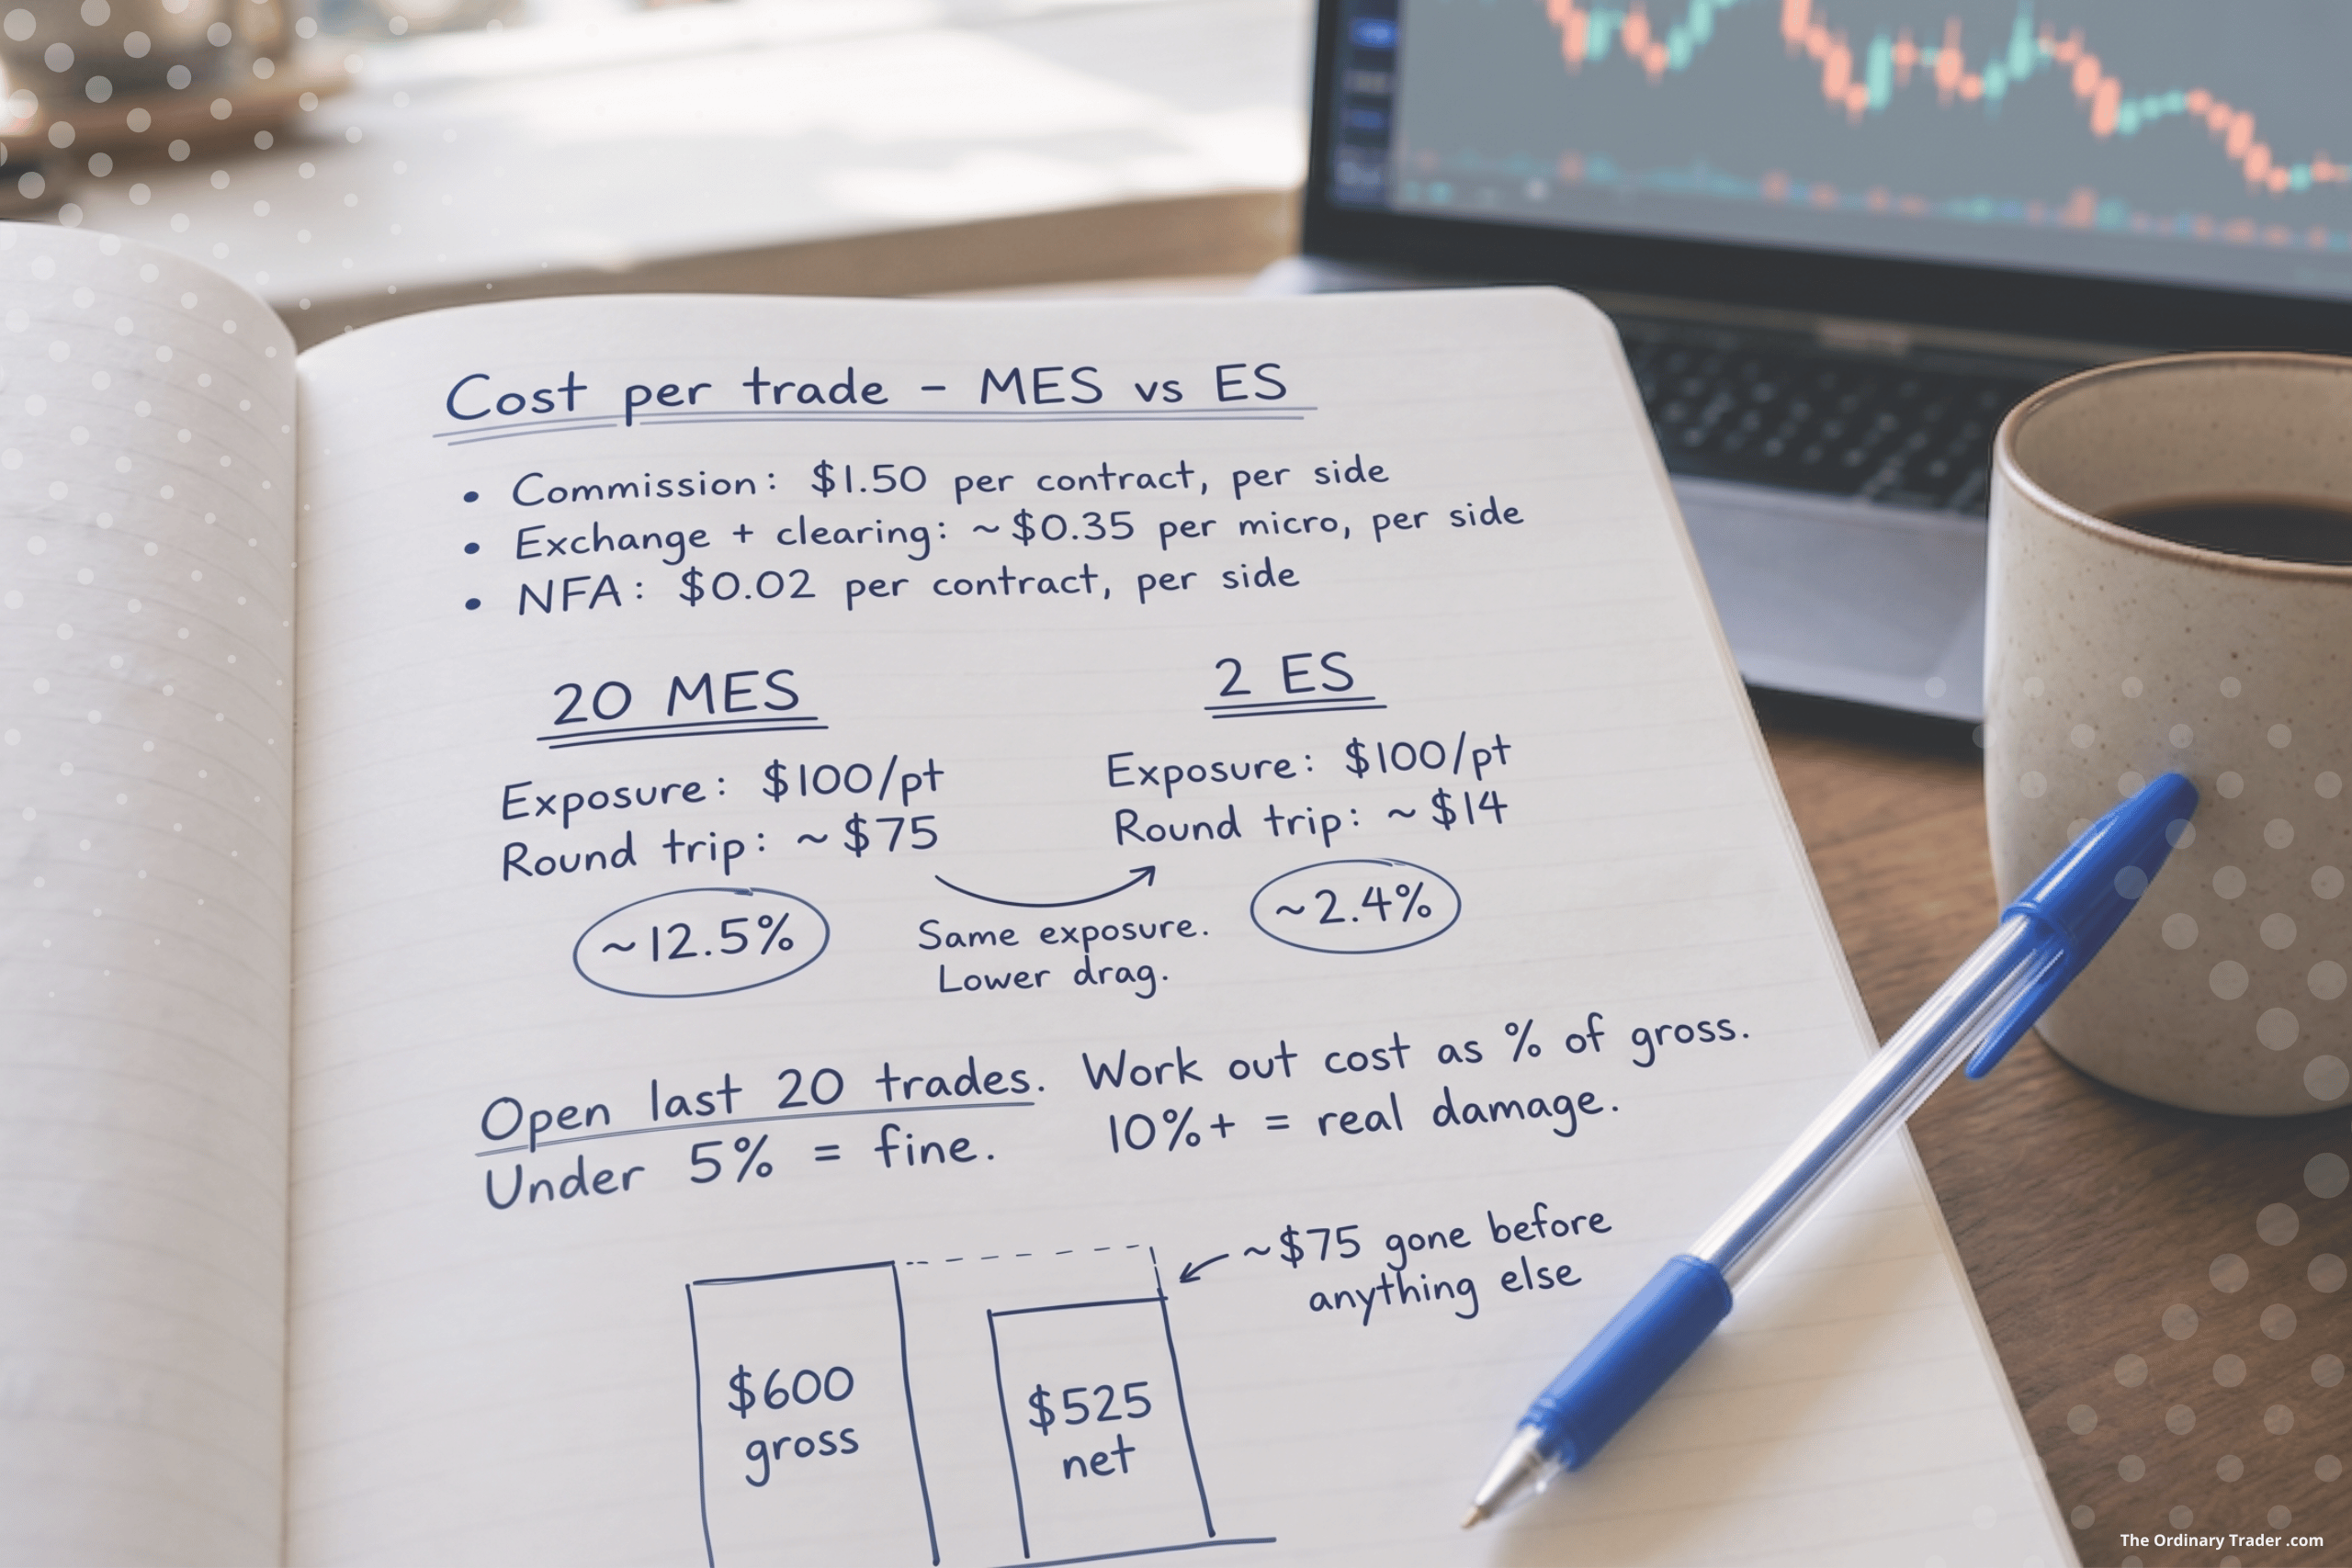
Put it all together and a round trip on 20 MES costs around $75. On a $600 winner, that’s about 12.5% of your gross gone before you’ve done anything else.
The fixed cost trap

Here’s where micros get interesting. The per-contract cost is low, which is why they look cheap. But the cost scales with the number of contracts, not with the size of the move.

A 6-point winner on 20 MES is $600 gross, about $525 net.

A 2-point winner on 20 MES is $200 gross, about $125 net.

Same costs, different percentages. The smaller the win, the more it stings. And the costs don’t care whether you win or lose. A $600 loser is really a $675 loser once you factor in the round trip.

20 micros versus 2 minis

The standard E-mini (ES) is ten times the size of the MES. So 10 MES equals 1 ES in terms of exposure. 20 MES gives you exactly the same exposure as 2 ES: $100 per point on the S&P 500.

Same exposure. Same risk. Very different cost structure.

20 MES 2 ES
Point value $100 per point $100 per point
Commission (round trip) $60.00 $6.00
Exchange + clearing + NFA (round trip) ~$15.00 ~$8.20
Total round-trip cost ~$75.00 ~$14.20
Net on $600 gross winner ~$525.00 ~$585.80
Cost as % of gross ~12.5% ~2.4%

The exchange fees on ES are higher per contract (around $2 per side versus $0.35 for MES). But because you’re using far fewer contracts to get the same exposure, the total cost drops sharply.

That’s a $60 difference on a single trade. Run that over 100 trades a year and it’s $6,000 sitting in someone else’s account that could have been in yours.

When micros still earn their place

This isn’t an argument against micros. They serve a real purpose.

Micros are the right tool when:

  • You’re new and learning, and the risk per point on ES is too large for your account
  • You want finer position sizing, scaling in or out in small increments
  • You’re trading a strategy where the maths only works at sub-mini size
  • Your account is small enough that one mini is too much risk per trade

Where micros stop making sense is when your typical position size creeps past 6 to 8 contracts and stays there. At that point, you’re paying a real premium for granularity you may not need. The cost of being able to trade 7 contracts instead of 0 or 10 starts to outweigh the benefit.

micros stop making sense is when your typical position size creeps past 6 to 8 contracts and stays there

Run the numbers on your own trades

The point is not to switch to minis tomorrow. The point is to actually know what your costs are.

A simple exercise. Open your last twenty trades. For each one, work out:

  • Your gross profit or loss
  • Your total round-trip cost (commission, exchange, NFA)
  • The percentage of gross your costs represent

If the average is under 5%, you’re probably fine. If it’s pushing 10% or more, the cost structure is doing real damage to your expectancy. Worth a conversation with your broker about volume tiers, or a serious think about whether you’ve outgrown your current contract.

Most brokers, TradeStation included, will negotiate rates for active accounts. The rates aren’t fixed. They’re rarely advertised, and you have to ask.

The boring lesson

There’s no trick here. No secret cost the broker is hiding from you. Just the discipline of sitting down once, working out what each trade actually costs, then making sure that number stays small relative to your average R.

A 12% drag on every win and a 12% surcharge on every loss is the kind of thing that doesn’t feel like much in the moment but quietly compounds against you over a year. The maths is on the screen if you bother to do it.

A real trade journal example of SMT divergence using NQ and ES. See how correlation breaks, liquidity shifts, and market structure alignment create high probability setups.

Have you ever watched a clean breakout on NQ, felt that surge of confidence, clicked in… and then watched it snap back like it never meant it?

It happens. And when it does, it feels personal.

Here’s the thing. Sometimes the breakout isn’t wrong. It’s just lonely.

That’s where SMT comes in.

SMT, or Smart Money Technique divergence, is a concept popularised by Michael J. Huddleston. Strip away the branding and what you’re left with is simple: when two markets that usually move together stop agreeing, pay attention.

It’s not prediction. It’s not a crystal ball. It’s context.

And when you’re trading sweeps, displacement, and structure shifts on 15m and 1m, context is everything.

First, Why ES and NQ Even Matter Together

We’re talking about S&P 500 Index futures (ES) and NASDAQ-100 futures (NQ).

These two are close cousins. Different personalities, same family.

They move together because:

Same Macro Drivers

Both respond to:

  • Interest rates
  • Inflation data
  • Fed commentary
  • Risk on / risk off flows
  • US economic data

If the market is broadly buying equities, both rise.

If fear hits, both sell.

Simple.

Heavy Tech Overlap

Mega cap tech dominates both indices. When Apple, Microsoft, or Nvidia move, both ES and NQ feel it. Big money flows hit them at the same time.

So most of the time, they confirm each other.

Which is exactly why it matters when they don’t.

But They’re Not Identical, And That’s The Opportunity

Here’s where it gets interesting.

  • NQ moves faster
  • NQ respects structure differently
  • NQ overshoots more
  • ES is smoother

NQ is like the energetic sibling. Quick. Emotional. Aggressive. It runs highs and sweeps lows with conviction. ES is steadier. Broader. It grinds levels instead of exploding through them.

If you trade 15m for bias and 1m for entries, you’ve probably felt this already.

In practical terms:

  • ES tends to give cleaner higher timeframe structure
  • NQ tends to give sharper lower timeframe reactions
  • NQ rewards precision more but punishes size harder

A lot of traders use ES for bias and execute on NQ. Not because it’s clever. Because it makes sense. One gives clarity. The other gives movement.

And movement is where your edge lives.

So What Is SMT, Really?

SMT shows up at liquidity.

Equal highs. Equal lows. Session extremes. Obvious 15m levels where everyone can see the stops sitting.

Now imagine both ES and NQ approach equal highs.

One breaks.

The other doesn’t.

That’s SMT.

In a bearish scenario, one index makes a higher high while the other fails to confirm. Buy side liquidity gets swept in one market, but not the other. If the broader equity complex were genuinely strong, both should expand together.

When only one runs the stops, something feels off. That breakout might be distribution.

In a bullish scenario, one index sweeps sell side liquidity below prior lows, and the other refuses to break. That relative strength hints that the breakdown may be engineered.

It’s subtle. But it’s powerful.

SMT isn’t the entry. It’s the raised eyebrow before the move.

Bringing It Into A 15m / 1m Model

Let me explain how this fits into a structured approach.

On the 15m chart, you mark liquidity on both ES and NQ. Equal highs. Equal lows. Protected highs and lows. Clean swing points. That’s your map.

When price approaches those areas, you watch behaviour.

If one index sweeps liquidity and the other doesn’t confirm, you don’t jump in. You wait.

Then you drop to the 1m.

You look for:

  • Change of character
  • Displacement
  • Clear structure shift
  • Defined risk in premium or discount

Now your trade isn’t just a sweep. It’s a sweep plus divergence plus structure.

That’s different.

That’s layered probability.

How Do You Know Which Index Is Leading?

This is the part most traders skip.

If one index breaks and the other doesn’t, how do you know which one to trust?

Keep it simple.

Ask yourself:

  • Which index has been trending cleaner during the session?
  • Which index is showing stronger displacement?
  • Which index is respecting structure better?
  • Which index holds above a breakout level instead of instantly rejecting?

The stronger index tends to confirm real moves.

The weaker index tends to produce failed breaks and liquidity sweeps.

It’s not about who moved first.

It’s about who holds.

That distinction often decides whether you trade continuation or fade the move.

What SMT Is Not

SMT is not:

  • A standalone strategy
  • A guaranteed reversal signal
  • A reason to trade against trend blindly
  • A shortcut around confirmation

It is context layered onto structure.

Without structure, it’s just observation.

A Final Thought

Incorporating SMT into your strategy can feel like a glimpse into the future.

When a sweep occurs in one index and is rejected by the other, reversal probability increases. Not always. But often enough to matter.

That extra layer of context often turns average setups into A+ opportunities.

You’re still trading structure. You’re still managing risk. You’re still waiting for confirmation.

But now you’re asking a better question before you commit:

Is this move confirmed?