Tag Archive for: Journaling

The number that feels like progress

You can win seven trades out of ten and still watch your account shrink.

It sounds wrong the first time you hear it. Win rate is the first number most new traders reach for, because it feels like a school grade. 70% sounds like a pass. 40% sounds like failure.

I spent my early months chasing that number. I wanted a strategy that was right more often than it was wrong, because being right felt like progress. The problem is that being right and making money are not the same thing. They are not even close.

Win rate is only half a sentence

A win rate on its own tells you how often you win. It says nothing about how much you win when you are right, or how much you lose when you are wrong. That second half is where your account is actually decided.

Here is the maths, kept simple. Say you win 70% of your trades, but your winners are small and your losers are large. You bank +0.5R on a win and give back -1R on a loss. Over ten trades, that is seven wins at +0.5R (+3.5R) and three losses at -1R (-3R). Net result: +0.5R across ten trades. A 70% win rate, and you have made almost nothing.

Now flip it. Say you win only 40% of your trades, but you let your winners run to +3R and cut your losers at -1R. Four wins at +3R (+12R) and six losses at -1R (-6R). Net result: +6R across ten trades, from a strategy that is wrong more often than it is right.

The trader who loses more often makes twelve times as much. Win rate did not tell you that. It could not.

The number that actually pays

The figure that matters is expectancy: what you can expect to make, on average, per trade. You work it out from both halves of the sentence.

Expectancy = (win rate x average win) – (loss rate x average loss)

Run the second example through it: (0.4 x 3) – (0.6 x 1) = 1.2 – 0.6 = +0.6R per trade. That is the number to know. It says that every time you place a trade to your plan, you can expect to make six tenths of your risk back, on average, over a large enough sample. Positive expectancy with enough repetitions is the whole game. Everything else is decoration.

This is why I stopped celebrating individual wins and stopped flinching at individual losses. A single trade tells me nothing. The average over a hundred trades tells me everything.

A single trade tells me nothing. The average over a hundred trades tells me everything.

What I track instead

Once you accept that expectancy is the destination, the day-to-day metrics change. These are the ones I keep in my journal now.

Average R per win and average R per loss, tracked separately. If my average loss is creeping above -1R, I am cutting too late, and no win rate will save me.

Expectancy per trade, in R, calculated across a rolling sample rather than a single day. One bad session does not move it much, which is the point.

Sample size. A positive expectancy over twelve trades is noise. Over a hundred and twenty, it is a signal. I do not trust any of my own numbers until the sample is big enough to mean something.

Process adherence, the one that is not about money. For every trade I log whether it was an A+ setup that met my filters, or whether I forced it. A profitable trade that broke my rules is still a bad trade. It just got lucky, and luck is not repeatable.

If you run the STRATEGY indicator, some of this is done for you. It has a stats panel that surfaces win rate, average RR and expectancy as you go, so you are not working the maths out by hand on a Sunday evening. The numbers matter more than where they come from, but having all three in front of you at once makes it harder to fixate on win rate and ignore the half of the sentence you would rather not look at.

Once you accept that expectancy is the destination, the day-to-day metrics change.

Why this is calmer, not just smarter

There is a quieter benefit to this. When your scorecard is win rate, every single loss feels like a mark against you, and you start trading to protect the number. You take profit early to lock in a win. You move your stop to avoid being wrong. Both habits shrink your average win and grow your average loss, which is exactly how a high win rate ends up with a flat account.

When your scorecard is expectancy and process, a loss inside your rules is not a failure. It is one of the six trades out of ten that you already knew would not work, paid for by the four that do. You stop needing to be right. You just need to be consistent.Once you accept that expectancy is the destination, the day-to-day metrics change.

Win rate is not useless. It is one input into expectancy, and a strategy with a dreadful win rate is hard to sit through even when the maths works. But on its own, as a measure of whether you are getting better, it is close to meaningless. Track the full sentence, not half of it.
The last trade is still in the room

You take a loss. A clean one, within your rules, nothing you did wrong. Then a valid setup appears twenty minutes later and you hesitate, because the last one stung and you do not want to feel that again. Or worse, you jump on it too hard, too big, because you want the loss back and this looks like the way to get it.

Either way, the trade you just took is being shaped by the trade before it. And that is the problem. On paper, each trade is independent. The market has no memory of your last position and does not care whether you are up or down on the day. But you have a memory, and it does care, and that mismatch is where a lot of accounts quietly bleed out.

The last outcome tells you nothing about the next one.

Statistically independent, emotionally connected

Your strategy works, if it works, across a run of trades. Any single one is a roll of the dice with an edge. The last outcome tells you nothing about the next one.

Your nervous system did not get that memo. A loss lands as a small threat, and the body responds the way it responds to threats: it wants to either avoid the thing that hurt or attack it. A win lands as reward, and the body wants more of it, faster. Neither of those instincts has anything to do with whether the next setup on your chart is worth taking. They are reactions to the previous trade, bleeding forward into a decision that should have been made fresh.

Left unmanaged, that carryover is what turns one loss into three, and one good win into a giveback. Not because the setups were bad, but because you were still trading the last one.

The two ways it goes wrong

After a loss, you get one of two failure modes. The first is timidity. You freeze on the next valid setup, or you take it at half size, or you talk yourself out of it entirely, because the fresh memory of losing makes the risk feel bigger than it is. You miss the trade that would have paid you back, precisely because the last one hurt.

The second is revenge. You come in hot, size up, and take something marginal because you need the money back now and patience feels unbearable. This is the more expensive of the two, and it never feels like revenge in the moment. It feels like conviction. It feels like you have spotted the trade that fixes everything. It is worth being honest that a sudden surge of certainty right after a loss is almost always the loss talking.

After a win, the failure mode is looseness. You feel sharp, the account is padded, and the discipline slackens. You take a setup that is not quite there because you can afford to be wrong, you size up because you are playing with the market’s money, and you hand a chunk of the win back to a trade you would never have taken cold. The win contaminated the next decision just as surely as the loss did.

Close the trade before you open the next

Detaching is not about feeling nothing. It is about having a deliberate gap between one trade and the next, so the emotional residue does not leak across.

The simplest version is a small closing ritual. When a trade is done, log it. Write down what the setup was, whether you followed your plan, and what actually happened, kept separate from each other on purpose. The act of writing it down marks it as finished. It is on the page now, not rattling around in your head. The trade is closed, in both senses.

Then put a real gap between that and the next click. Stand up. Leave the desk. Let the heart rate come down. The urge to immediately get back in is the residue itself, demanding to be acted on, and stepping away is how you refuse it. The trader who takes two minutes away from the screen after a result is usually the one who comes back able to see the next setup clearly.

When you sit back down, judge the next trade on its own merits and nothing else. Does this setup meet the checklist, right now, as if the last trade never happened? If yes, take it at your normal size, whatever just happened. If no, you do not take it, no matter how badly you want the loss back or how invincible the win made you feel. The previous trade gets no vote.

Detaching is not about feeling nothing. It is about having a deliberate gap between one trade and the next, so the emotional residue does not leak across.

The clean slate is the skill

Nobody talks about this as a skill, but it is one, and it is trainable. Every trade you close properly and start fresh is a rep. Over time the gap between trades stops feeling like willpower and starts feeling like routine.

The market gives you a clean slate on every trade whether you use it or not. It has already forgotten your last position. The only thing standing between you and that same clean slate is the residue you are still carrying. Put the last trade down. The next one deserves a decision made from scratch.

You open the economic calendar (usually forexfactory) before the session, scan for red folders, and find nothing. No CPI. No jobs report. No central bank speakers. The day looks clear.

Most traders read that as a green light. A safe day. Nothing to blow up the chart, nothing to catch them off guard.

It’s not that simple.

A day with no scheduled news behaves differently from a day with a report on it, and those differences are easy to miss until they’ve cost you.

What “safer” actually means

There’s a real kernel of truth in the safety idea. High-impact releases like CPI or non-farm payrolls can move the futures market hard and fast. On the S&P (ES) you can see 20 to 80 points in the first few minutes of a release. On the Nasdaq (NQ) it can be 100 to 400. When the number hits, price can move so fast that your stop doesn’t just get triggered, it fills at a worse price than you set, because there’s nobody there to fill you where you wanted.

Take the scheduled release away and that specific risk drops. No data drop means a much lower chance of a sudden spike that runs your stop before you can think. In that narrow sense, a no news day is safer.

But safer from a spike is not the same as easier to trade. Those are two different questions, and people collapse them into one all the time.

No news doesn’t mean clean charts

Here’s the part that catches people out. A news release isn’t only a risk. It’s also fuel.

Big releases bring participation. They give the market a reason to pick a direction and commit to it. Some of the cleanest trending days of the month are built on a catalyst, with price opening near one end of the range and closing near the other.

Strip the catalyst out and you often strip out the conviction with it. With fewer participants and thinner liquidity, price has less to push against. Moves start and stall. Every small push looks like the start of a trend and then fades. Stops get hunted in both directions because there isn’t enough order flow to hold a move together.

A news release isn’t only a risk. It’s also fuel.

That’s not a guarantee. A no news day that inherits a clear story from the session before, a strong close or a level everyone is watching, can still trend nicely. So it isn’t the absence of news that decides the day, it’s the absence of a story. An empty calendar just removes one of the most common reasons a market trends cleanly, which tilts the quiet day towards rotation and chop.

And most days are chop anyway. Markets spend far more time ranging and digesting than they do trending. A no news day just tilts the odds further in that direction.

Easy or hard depends on you, not the day

So is a quiet day easy or difficult? Honestly, that’s the wrong question.

A range-bound, low-conviction session is difficult if you trade it like a trend day. You chase the breakout, it fails, you flip, that fails too, and you’ve taken three trades in a market that was never going anywhere. That’s how a slow day quietly does more damage than a fast one.

The same day can be straightforward if you match your approach to it. Fewer trades. Tighter, more realistic targets. Patience for the spots where structure is actually clear, and a willingness to sit on your hands everywhere else. The market hasn’t changed its difficulty. You’ve changed whether you’re fighting it.

The calendar is the first thing I look at before a session, and this is where journaling earns its place. If you look back and see that your worst results cluster on quiet, newsless days, that’s not bad luck. That’s a mismatch between the conditions and how you traded them.

The quiet day before CPI is the one to watch

There’s one no news day that deserves special attention, and it’s the calmest-looking one of all. The day directly before a major release like CPI or an FOMC decision.

On paper, the calendar that day is empty. In practice, the market is already bracing for tomorrow.

Ahead of a big print, the professional desks do the opposite of what you’d expect. They take risk off rather than add it, because a surprise is a wild card they can’t control. On FOMC days the build-up has been clocked at 20% to 35% below average volume, with the daily range squeezing to a third or a half of a normal session. Liquidity thins out. The book gets shallow.

The result is a coil. Price grinds sideways in a tightening range while everyone waits. To an impatient trader it looks like a free, easy market. It is anything but. Thin conditions mean false breakouts fire constantly, and the liquidity that builds up sits at the obvious highs and lows of the range, right where stops cluster. It’s not unusual for price to sweep one side, then the other, clearing those stops before the real move ever arrives on the news.

Price grinds sideways in a tightening range while everyone waits.

So the day before CPI is a compression spring dressed up as a quiet afternoon. The mistake isn’t trading it. The mistake is trading it as though tomorrow isn’t coming, or worse, carrying a position into the print itself and hoping.

So, are no news days good for trading?

They’re not good or bad. They’re a different kind of day, and the job is to read which kind you’re in before you decide how to trade it, or whether to trade it at all.

The calendar isn’t a green light or a red one. It’s the first line of your plan. It tells you what kind of session to expect, so you can size and pace yourself to match. Read it that way, and a no news day stops being a trap and becomes just another set of conditions to trade well, or to leave alone.

Most blown accounts don’t die from a single dramatic loss. They die quietly, from one bad habit repeated until the balance runs out.

The frustrating part is that none of these habits feel like mistakes in the moment. They feel like instinct. They feel like you’re doing something. And that is exactly why they’re so hard to spot in yourself.

So here are the worst of them. Some are genuinely expensive. Some are just a bit silly. I’ve been guilty of most, which is the only reason I can describe them so precisely.

Revenge trading: the most expensive way to feel better

You take a loss. It stings. Instead of closing the laptop, you immediately look for the next trade to win it back.

This is the big one. Revenge trading is what turns a bad trade into a bad day, and a bad day into a bad week.

The logic feels airtight at the time. The market took something from you, so you’re going to take it back. But the market doesn’t know you exist, and it certainly doesn’t owe you a refund. What actually happens is you trade bigger, with less patience, on a worse setup, while your judgement is at its lowest point of the day.

The fix isn’t complicated. It’s just hard. After a loss that gets under your skin, you stop. Not “stop after one more.” Stop.

Collecting indicators like they’re going out of fashion

Here’s the stereotype, and you’ve met him. The chart so crowded with indicators it looks like air traffic control. Three moving averages, two oscillators, a cloud, volume profile, and something with a German name you found on a forum at 2am.

You’re not reading the market. You’re waiting for all eleven things to agree, which they never do, because half of them are measuring the same price action in slightly different colours.

More inputs don’t make a clearer decision. They just make more noise. The trader who watches structure and one or two clean levels usually sees more than the one drowning in confluence. A chart should help you think, not hide the thinking.

The trader who watches structure and one or two clean levels usually sees more than the one drowning in confluence.

Moving the stop loss because “it’ll come back”

You set a stop. Price moves towards it. And right before it hits, you drag it a little further away. Just to give the trade room.

It usually does come back, the first few times. That’s the trap. The market teaches you the worst possible lesson by occasionally rewarding the worst possible behaviour.

Then one day it doesn’t come back, and the loss you’ve been avoiding arrives all at once, several times larger than the one you originally agreed to take. A stop loss you move isn’t a stop loss. It’s a suggestion you make to yourself and then ignore.

The whole point of deciding your risk before the trade is that the version of you placing the trade is calmer than the version of you watching it go wrong.

Only ever posting the wins

This one is more of a culture problem than a personal one, but it shapes how everybody else behaves.

Scroll through any trading feed and you’ll see an unbroken stream of green. +400%. Account up. Another clean win. Funny how nobody seems to post the day they blew up and gave it all back.

The selective screenshot is the dishonest heart of trading culture. It sells a version of the job that doesn’t exist, where every entry is a winner and the equity curve only points one way. New traders see it, assume that’s normal, and then quietly panic when their own results look like real results, which is to say lumpy, occasionally red, and slow.

I’d rather see someone’s losing month than their best ever day. The losing month tells me how they handle the part of trading that actually decides whether they last.

Funny how nobody seems to post the day they blew up and gave it all back.

Trading without a journal, then wondering what went wrong

If you don’t write down what you did, you can’t learn from it. You can only remember it, and memory is a generous liar.

Ask a trader without a journal why they lost last week and you’ll get a feeling, not an answer. “I think I was overtrading.” Maybe. Or maybe you took the same B-grade setup eleven times and it lost eight, and you’d know that for certain if it were written down.

A journal turns vague guilt into specific evidence. It’s the difference between “I need to be more disciplined” and “I lose money every time I trade the first ten minutes of the session, so I’ll stop doing that.” One is a New Year’s resolution. The other is a rule.

It doesn’t need to be fancy. A notebook and an honest sentence about each trade beats a spreadsheet you never open.

The habit underneath all the habits

Look closely and most of these share a root. They’re all ways of avoiding a small, uncomfortable thing now, in exchange for a larger, worse thing later. Skip the loss, skip the discipline, skip the honest record, skip the boredom etc

Good trading is mostly the willingness to be a bit bored and a bit uncomfortable on purpose. Not careless or reckless, but controlled. The best habits aren’t exciting. They’re just the unglamorous things, done again and again, on the days you don’t feel like it.

The best habits aren’t exciting. They’re just the unglamorous things, done again and again

That’s the whole job, really. Spot the habit, name it honestly, and replace it with something duller and better.

You sit down to review yesterday’s trade. The chart is still there. The entry, the exit, the result, all logged. But the part you actually need has gone. What were you thinking when you moved that stop? Why did you nearly close the position early? You can’t quite remember.

That critical lost in detail is the whole reason I journal. And it is why I care more about the notes than the numbers.

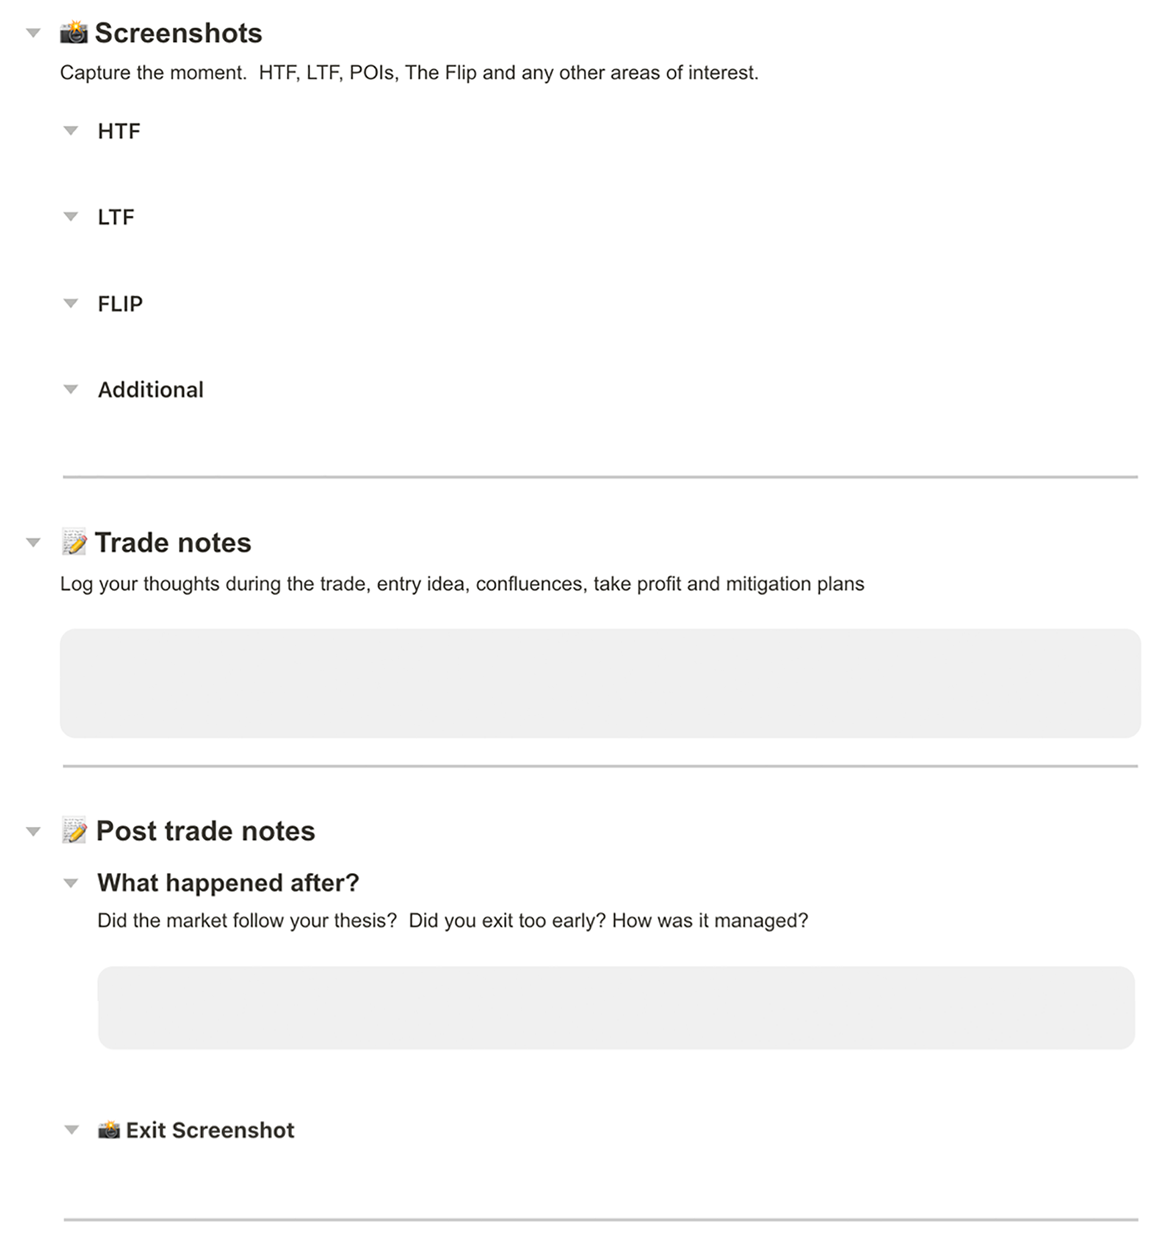
I use TradeZella for this. It is a solid platform, and most people know it for the stats: win rate, average R, all the dashboards. Useful, but not what this post is about. I want to talk about the Notes side, where you capture what you were thinking and feeling before, during and after a trade. Tags and Strategies are worth their own post another day. For now, here is the template I use and how I actually use it.

That critical lost in detail is the whole reason I journal.

Three sections, one job

My template has three parts. Screenshots, Trade Notes, and Post Trade Notes. Each one captures a different slice of the same trade, and together they let me rebuild the whole thing later without relying on memory.


Screenshots: capture the moment

The first section is just images. I take a few as the trade develops, not all at the end.

A higher time frame shot (HTF, usually the 15 minute) to show the structure and the bias. A lower time frame shot (LTF, usually the 1 or 2 minute) for the detail of the entry. A zoomed-in shot of The Flip, because that is a key part of the setup I want to study again later. And an Additional slot for anything else worth keeping: the Path to Profit, a point of interest (POI) like a supply and demand zone (SNDR) or a fair value gap, whatever mattered on the day.

A fair value gap, by the way, is just the imbalance price leaves behind when it moves too fast to trade an area cleanly.

The reason I screenshot in the moment is that a chart looks completely different an hour later. Price has moved on, levels have been swept, and the thing that looked obvious at entry is buried. The screenshot freezes what I actually saw.

And this is the part most people skip. I write down how I am feeling.

Trade notes: the thinking and the feeling

This is the main section, and the one that does the most work.

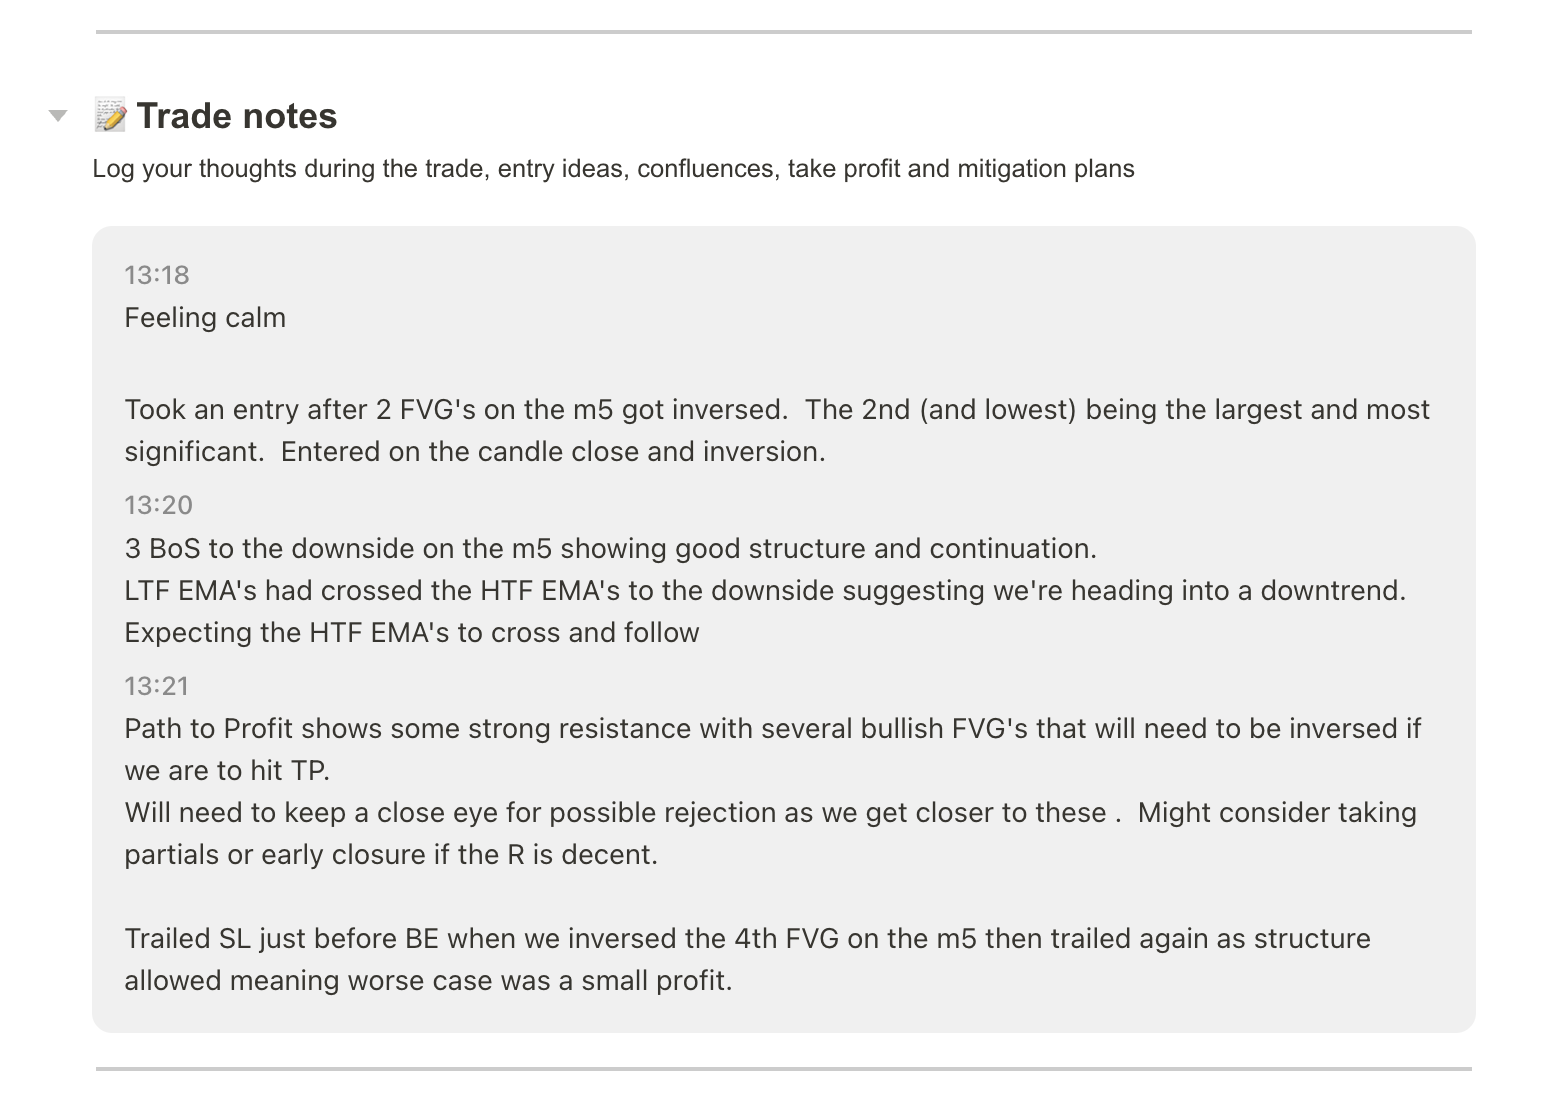
Here I write my thesis before I enter. The idea, the confluences, where I expect price to react, my take profit plan, and how I will manage the trade if it goes against me. Getting this down before entry matters, because it is the version of my thinking that has not yet been bent by an open position.

Then I keep adding to it as the trade runs. And this is the part most people skip. I write down how I am feeling.

That sounds soft. It is not. Emotion is where most of my mistakes start, and the only way to catch the pattern is to have it written down in your own words at the time. Read it back later and you can often see exactly where a feeling got in the way of a perfectly good setup. Sometimes it works the other way, and a note of unease turns out to be a warning sign you should have listened to.

Post trade notes: what actually happened

The last section is the review. I answer a few plain questions.

What happened after I took the trade? Did the market follow my thesis, or not? Did I exit too early, or enter too early? How did I manage it? Then the one that matters most: what would I do better next time, and if I could go back, what is the single piece of advice I would give myself?

This section also holds the exit screenshot. Did I hit my target, get stopped out, or close manually? I grab the final chart, and often what happened next too. Plenty of times I have hit TP1 and then watched price run on to take the previous day’s high. Capturing that teaches me something about where I am leaving money, and whether my targets are too conservative.

Capture it live, not from memory

I keep the journal open on my screen the entire session, next to the chart. I write as I go, in real time, as I enter and manage.

If you leave it until the evening, you do not really journal the trade. You are actually journalling your memory of the trade, which is a tidier, kinder, less accurate version of events. The hesitation gets smoothed over. The near-miss exit disappears. The thing you most needed to see is exactly the thing memory edits out.

You are actually journalling your memory of the trade, which is a tidier, kinder, less accurate version of events.

One trade, fully journalled, before the next

One rule I hold myself to. I do not take another trade until the first one is journalled and the lesson is captured.

Easier said than done, especially on an active session. But the moment you skip it “just this once,” the journal stops being a record and starts being a highlight reel. I treat finishing the journal as part of finishing the trade.

None of this is here to make me feel good about wins or bad about losses. It is here to make my behaviour visible. When I follow my rules, the results tend to take care of themselves. When I do not, the journal shows me exactly where. The chart only ever tells me what I did. The notes are the only place that remembers why.

February wasn’t a headline month.
It was a character month.

On paper, the summary looks simple:

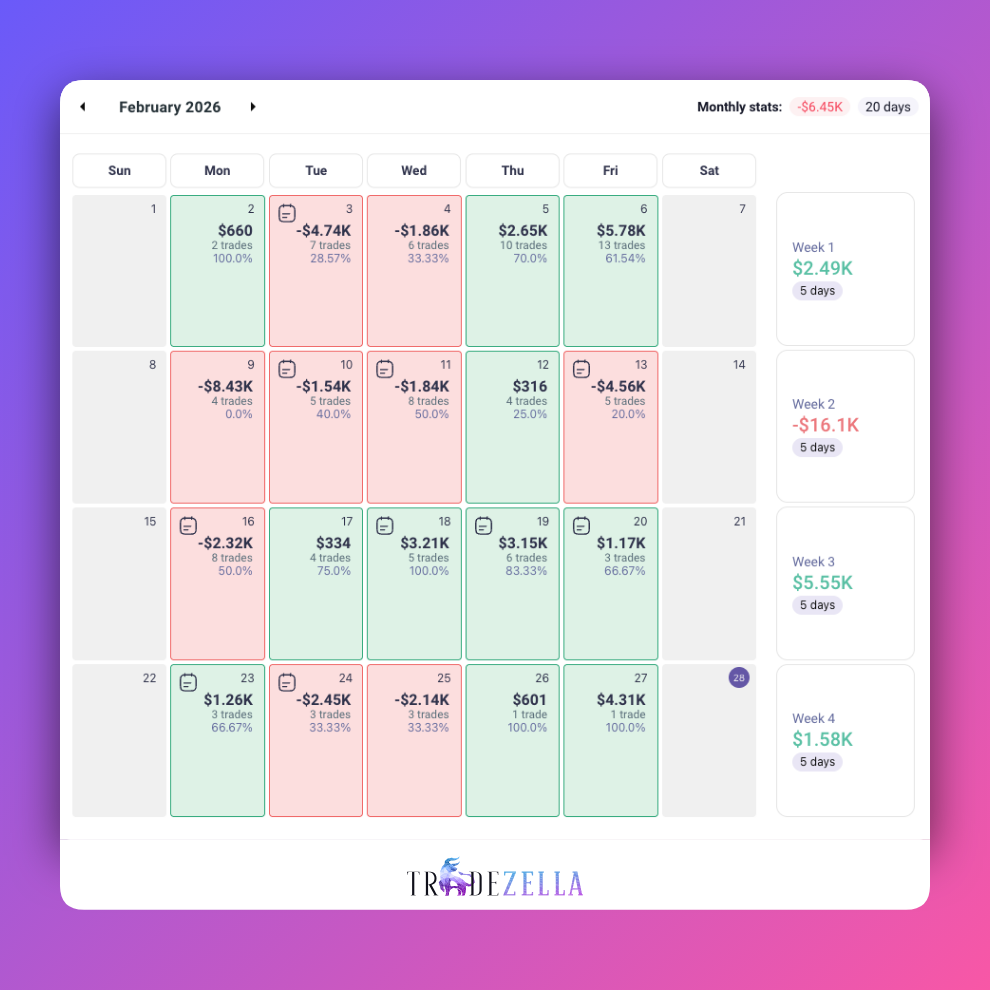
  • Monthly P&L: -$6.45K
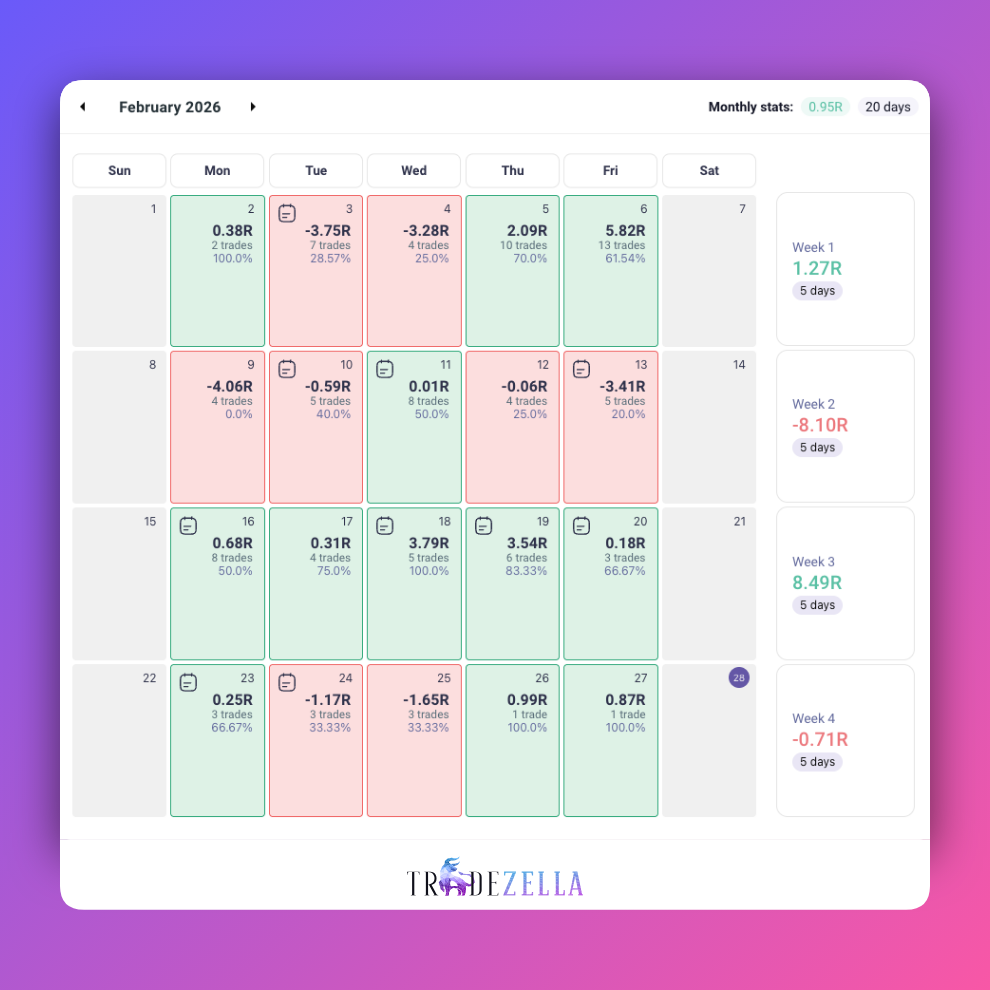
  • Monthly R: +0.95R
  • Trading days: 20
  • Green weeks: 3 out of 4
  • Red weeks: 1 significant (Week 2)

Depending on the lens you use, this month tells two different stories.

In dollars, it’s red.
In R, it’s slightly green.

That disconnect matters more than it first appears.

As I’ve written before, this project isn’t about performance theatre. It’s about documenting ordinary work done consistently over time . February fits that philosophy perfectly.


The Bigger Picture: When One Week Tries to Define the Month

Here’s the R breakdown:

  • Week 1: +1.27R
  • Week 2: -8.10R
  • Week 3: +8.49R
  • Week 4: -0.71R

Week 2 did the damage. A concentrated drawdown. No drama, but real impact.

Week 3, though, showed what happens when structure, patience, and selectivity align. +8.49R across five days isn’t noise. That’s execution.

Week 4? A “good loss.” -0.71R. Contained. Controlled. Boring, almost.

And boring is often good.

If you’ve followed the previous updates, you’ll recognise the theme. This wasn’t about chasing big weeks. It was about containment. When risk stayed defined, the account stabilised. When discipline slipped, losses clustered.

That’s not a revelation. It’s just reinforcement.

What Went Well (And Why It Matters)

1. Risk Containment Improved

There were red days. Several.

But very few spirals.

The guardrails held up better than earlier months:

  • Max 5 trades per day
  • Max 2R daily loss

February could have turned messy. It didn’t.

The -8R week stayed in its lane. It didn’t bleed into Weeks 3 and 4. That separation is growth. Not flashy growth. Structural growth.

And in trading, structural growth compounds faster than excitement ever will.

2. Recovery Without Revenge

Week 3 delivered +8.49R. That wasn’t emotional trading. It wasn’t trying to “get back” at the market.

It was alignment.

When conditions suited the strategy, execution was clean:

The recovery wasn’t dramatic. It was mechanical. Follow the plan. Let it work.

This is something I’ve talked about before — the idea that most mistakes don’t come from bad analysis, but from trying to improve a trade that’s already working . The same applies at the weekly level. Over-managing a drawdown often causes more damage than the drawdown itself.

3. Selective Days Were the Strongest Days

Some of the best sessions in February were single-trade days.

  • One trade. 100% win rate.
  • $4.31K on one position.
  • 0.99R, clean and simple.

That’s not volume. That’s precision.

There’s a quiet lesson here: more trades rarely equal more profit. In fact, the opposite is often true. The higher trade-count days were statistically weaker — lower win rates, more mid-range losses, less clarity.

Fewer trades. Better structure.

It keeps repeating for a reason.

What Needs Tightening Up

February wasn’t a setback. But it wasn’t flawless either.

1. Drawdown Clustering

Week 2 came in at -8.10R. Not catastrophic. But concentrated.

Looking at those losing days, the pattern is clear:

  • Mid-range losses between -1R and -4R
  • Win rates around 20–40%
  • Higher trade counts

Translation? Forcing flow in less optimal conditions.

It’s likely discretion crept in — over-trusting continuation without enough higher-timeframe confirmation. The setups weren’t terrible. They just weren’t strong enough to justify the frequency.

The solution isn’t complexity. It’s patience.

2. Dollar Volatility vs R Consistency

Here’s the uncomfortable part.

The month finished slightly positive in R but negative in dollars.

That suggests uneven sizing. Possibly scaling inconsistently on higher-conviction days. Or exposure spread across multiple accounts in a way that diluted R-to-dollar alignment.

For Project 1 Million, R is the anchor. R defines expectancy. Dollars follow.

But the gap is a reminder: structure first. Size second.

Scaling should reflect edge strength, not confidence level.

3. Neutral Days That Could Have Been Zero

There were a handful of small bleed days:

  • -0.59R
  • -0.06R
  • -1.17R
  • -1.65R

Individually small. Collectively meaningful.

The question is simple: did those sessions require participation?

Not every day needs action. Some days are better observed than traded. The discipline to sit out is often harder than the discipline to cut a loss.

And yet, it may be the more important skill.

Statistical Observations: What the Data Actually Says

Looking across the calendar, a few patterns stand out:

  • High win-rate days were often green — but not always large.
  • Some strong green days had moderate win rates, supported by solid R:R.
  • The worst days combined higher trade counts and lower win rates.
  • One strong week can offset a poor week — if risk stays stable.

Win rate alone is irrelevant.

Structure and R:R define survival.

That’s not new information. But it’s easy to forget when a week goes red.

The Honest Summary

February did not materially move Project 1 Million forward.

But it didn’t erode the structure either.

The account absorbed:

  • An -8R week
  • Multiple red days
  • Uneven market conditions

And still finished roughly flat in R.

That matters.

This is the middle phase. No hero months. No implosions. Just process under pressure.

And if the philosophy is to treat trading as ordinary work — done consistently, without hype or drama — then February fits.

No celebration. No panic. Just review.

Focus for March: Quiet Adjustments

March doesn’t require reinvention. It requires refinement.

The priorities are clear:

  • Protect against clustered drawdowns
  • Be willing not to trade
  • Scale only with clean higher-timeframe alignment
  • Continue prioritising structure over frequency

The goal isn’t explosive growth.

It’s asymmetry:

  • Small red
  • Contained flat
  • Occasional strong green

That’s how compounding works. Not through heroics. Through containment.

February was not impressive.

But it was controlled.

And sometimes, control is the most underrated edge in trading.

23rd – 27th February

Week 9 was a quieter week. Not dramatic. Not explosive. Just controlled.

Coming into it, the focus was very specific. I wanted to double down on discipline. That meant sticking to my trading planner rules without exception:

  • Maximum 5 trades per day
  • Maximum loss of 2R
  • Profit target of 2R
  • No deviation from 1 percent risk

In terms of execution, this was genuinely an A+ week. I followed the rules. I did not oversize. I did not chase. I did not break daily limits out of frustration or excitement. That might sound basic, but consistency in rule adherence is still the foundation of everything.

Now for the honest part.

The week closed slightly red at -0.71R.

There is no dressing that up. It was a losing week. But context matters. The loss was small. It was contained. It stayed well within predefined limits. That is what risk management is supposed to do.

If the model is working correctly, losing weeks will happen. The key is ensuring they are controlled, while winning weeks are allowed to expand.

If the model is working correctly, losing weeks will happen. The key is ensuring they are controlled, while winning weeks are allowed to expand. By that definition, this was what I would call a good loss.

What makes it more interesting is that I actually had more wins than losses. Six wins. Five losses. A 54.55 percent win rate.

Accuracy was not the issue.

The issue was upside. Many of the winning trades were under 1R. There were fewer runners. Without extended moves, the expectancy tightens quickly. When you cap downside effectively but fail to capture larger upside, the edge compresses.

That leads directly into the work I am doing behind the scenes.

Exit strategy testing continues. I am comparing different models, including fixed targets, partials, extended targets, and trailing approaches. Some early patterns are already emerging, but it is still too soon to draw firm conclusions.

Right now the objective is simple:

  • Log every trade consistently
  • Apply the same rules each session
  • Remove discretion from exits where possible
  • Build a meaningful sample size

Once I have tracked around 50-100 trades under consistent conditions, the data will start to speak clearly and I’m looking forward to sharing.

Week 9 was not about big numbers. It was about professional behaviour. The PnL was slightly red. The execution was green.

Over time, that combination is what compounds.

15th – 21st February

Week 8 felt different.

Not explosive.
Not dramatic.
Just steady.

After the turbulence of previous weeks, the focus coming into this one was simple: tighten execution, reduce noise, and behave like a professional.

The Plan

Going into the week, I set five clear rules:

  • Maximum 5 trades per day. Use the trade planner properly.

  • Only take true A+ zones.

  • Keep risk fixed at 1 percent. No oversizing. If resizing, it must be down, never up.

  • Validate structure on at least one timeframe higher before committing.

  • Reassess trailing stop placement relative to the timeframe of entry.

Nothing new. Nothing revolutionary.
Just better discipline.

The Reality

For the first time in a while, I felt genuine alignment between higher timeframe and lower timeframe structure.

Instead of marking up charts mechanically, I began to see how they overlapped.

A protected low on the higher timeframe could also serve as a shared protected low inside a lower timeframe zone. When those two lined up, the setup carried more weight. More confluence. More confidence.

That shift alone changed the quality of trades I was willing to take.

Fewer Trades, Better Decisions

I did not oversize once this week.

That matters more than it sounds.

Keeping risk fixed at 1 percent created emotional stability. There was no internal pressure to “make it back faster.” No temptation to lean heavier on volatile instruments.

Trade frequency also improved. I passed on many setups that I would have taken a few weeks ago. Patience is starting to feel less like restraint and more like strategy.

Ironically, I also identified multiple setups that went on to be great winners without me.

That is an important lesson.

There is a difference between patience and being too demanding on the pullback. If price does not retrace perfectly into your preferred level, sometimes the market simply moves without you. That is an area to refine moving forward. Not by lowering standards, but by avoiding greed in the entry refinement.

Performance Overview

In R terms, Week 8 closed +8.22R across 5 trading days.

In dollar terms, that translated to approximately +$5.18K.

After a difficult Week 7, that kind of rebound feels significant. Not because of the number itself, but because of how it was achieved.

  • No oversized positions

  • Reduced trade count

  • Better structural alignment

  • Cleaner execution

The process improved first. The results followed.

That is the order it should always be in.

Exit Strategy Experiments

One of the most valuable developments this week has been the start of structured exit testing.

I’ve begun comparing:

  • Fixed 1R

  • Partials

  • 1.5R targets

  • Full runners

  • Trailing scenarios

Instead of guessing, I’m running the data.

The goal is not to find the most exciting outcome.
It is to find the most consistent, repeatable one.

Over time, this testing should remove another layer of emotional decision making. Exits should be predefined, not improvised.

Bonus: A Milestone

Quietly, and slightly unbelievably, I passed three prop firm challenges this week.

Not one.
Not two.
Three.

Current funded capital now sits at $250K.

That is real progress.

It is easy to get distracted by daily PnL swings, but zooming out shows something else entirely. Structure is improving. Risk management is tightening. Emotional reactions are decreasing.

Funding is increasing.

The Bigger Picture

Week 8 was not about chasing big numbers.

It was about:

  • Respecting higher timeframe structure

  • Trusting confluence

  • Keeping risk consistent

  • Letting the edge play out

Ordinary discipline produced extraordinary stability.

And that is the direction this project needs to continue.

Trade well. Stay ordinary.

This is the first post in a new monthly series where I share my real trading results.

Not highlights. Not best days only. Not a sales pitch.

Just the numbers, the behaviour behind them, and what I am learning as I go.

The aim is simple. To track progress over time, stay accountable to my own rules, and hopefully provide something more realistic than the polished versions of trading that usually get shared.

This is Month 1.

How to Read the Images

Before getting into the results, a quick note on how to interpret the screenshots.

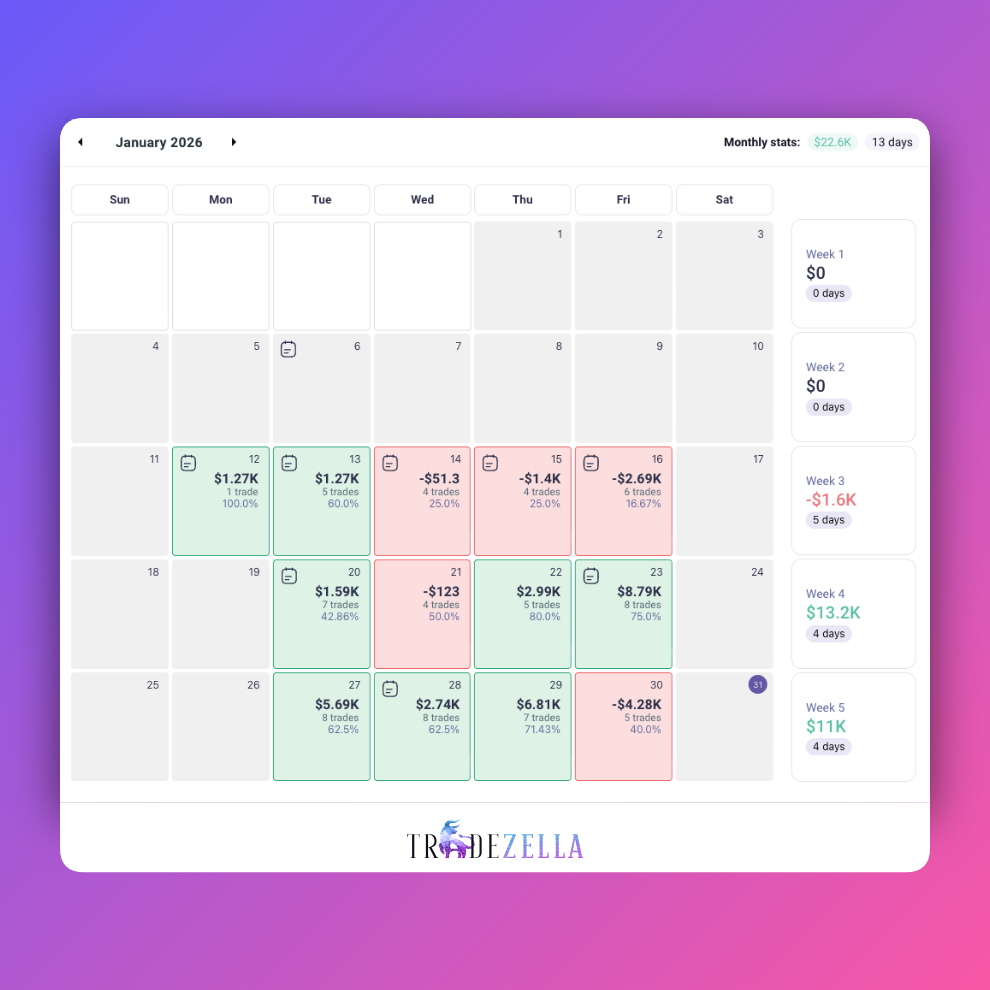
Each day shows both R and dollar PnL.
R measures performance relative to risk. Dollars show the real-world impact of those decisions.

Green and red days are not the story on their own. What matters more is trade count, win rate, and how losses behave when things are not going well.

If you are new to this, think of R as the decision-making lens, and dollars as the consequence.

Both matter, but they play different roles.

Why I Still Think in R First

R remains my primary metric because it keeps the focus on process rather than outcome.

It standardises risk, removes position size bias, and makes performance comparable across days, weeks, and months. A +3R day achieved cleanly is far more useful information than a random dollar figure taken out of context.

The dollar view exists to keep things honest. It reminds me that risk is real and that behaviour has consequences. But it is not what drives decisions in the moment.

R governs the process. Dollars reflect the result.

The worst red days tend to follow periods of over-engagement, often driven by trying to make something back within the same session.

The Big Picture

This month was uneven, but instructive.

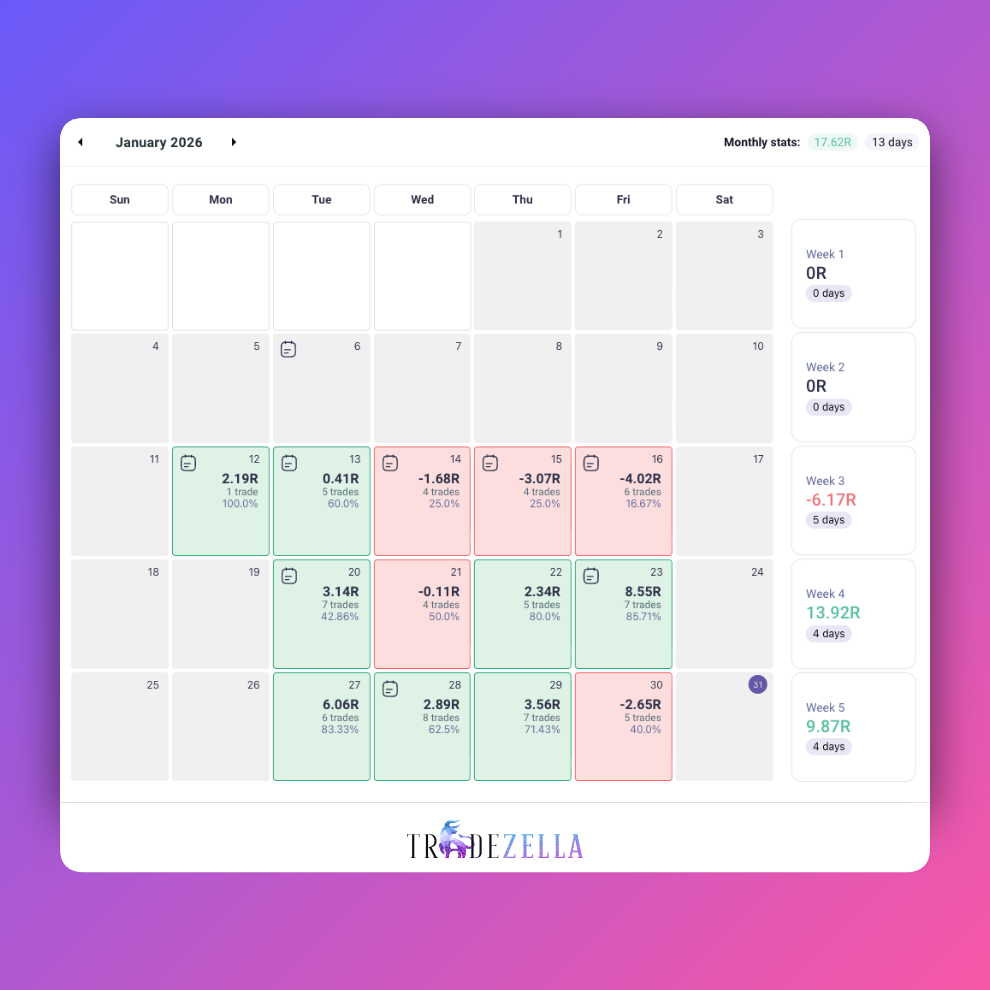
Firstly, I only started journalling from Monday the 12th. The 19th was a stock market holiday, and I took the 26th off to attend a person training course. So this was not a full, uninterrupted trading month.

Even so, clear patterns emerged.

There was one difficult drawdown week early on, followed by two strong weeks where execution, discipline, and consistency improved noticeably. The contrast between those periods is the most important takeaway from this review.

The Difficult Start

Week 3 finished down -6.17R, or roughly -$1.6K.

More important than the number is how it happened.

This was before I was properly journalling, and it shows. Win rates were low, trade counts were high, and patience was thin. Losses clustered, not because the strategy stopped working, but because behaviour slipped.

There was some overtrading, some forcing, and a tendency to try to recover losses within the same session. In hindsight, the red days were not surprising.

At the time it felt frustrating. In review, it feels useful.

What Changed

From the 12th onwards, things began to stabilise.

Not perfectly, and not immediately, but enough to notice. Journalling introduced friction. It forced me to slow down, articulate reasons for entries, and reflect on exits rather than rushing to the next setup.

Even later red days still finished negative, but the damage was contained. Losses did not spiral, and trade behaviour stayed more deliberate.

That shift alone feels like progress.

The Stronger Weeks

Weeks 4 and 5 were the most encouraging.

Together they produced +23.79R, or just over $24K, with win rates regularly in the 60 to 80 percent range. These were not single outsized trades or lucky spikes. They came from multiple trades executed reasonably well, without stretching size or forcing targets.

What stood out most was not the PnL, but how repeatable those sessions felt. The process was clearer, entries were more selective, and exits were more disciplined.

When I slow down, the edge shows up.

A Few Honest Observations

One ongoing issue is trade volume.

On several green days I exceeded my own five trades per day rule. It worked out this time, but that does not make it good behaviour. The data suggests my best days tend to come from fewer, higher-quality trades rather than maximum participation.

Another clear pattern is how losses cluster. The worst red days tend to follow periods of over-engagement, often driven by trying to make something back within the same session.

Again, this is behavioural, not technical.

Common Misreads of the Dollar View

A few things are worth addressing directly.

This was not a straight line up.
The dollar results reflect both good weeks and difficult ones.

The strong days did not come from oversized risk.
Position sizing stayed consistent. The gains came from execution, not leverage.

The red weeks were not failures.
They were part of the learning curve, and they exposed issues that are now being addressed.

If anything, the dollar view reinforces why discipline matters. Behaviour shows up very quickly when the numbers are real.

What This Month Reinforced

This first month made a few things very clear.

  • Journalling improves execution.
  • Slowing down improves win rate.
  • Drawdowns are usually behavioural.
  • Consistency comes from repetition, not intensity.

None of that is exciting. All of it matters.

Why I’m Sharing This

I’m sharing these posts partly for accountability, but also because trading often lacks transparency.

Most people only ever see the best days or the biggest months. Real progress looks different. It includes red weeks, missed sessions, rule breaks, and gradual improvement rather than sudden breakthroughs.

If this series shows anything over time, I hope it is that progress is possible without hype, without shortcuts, and without pretending the hard parts do not exist.

This was Month 1.

On to the next, with fewer trades, better notes, and more patience.

For a long time, I believed my edge would come from better charts. Cleaner levels. Tighter entries. More confluence. If I refined the technicals enough, consistency would follow.

What actually changed my trading wasn’t on the chart at all.

I started journaling properly when I realised I was making the same mistakes across different markets. Different instruments. Different days. The outcomes kept repeating.

The chart had changed but my behaviour hadn’t.

The chart had changed but my behaviour hadn’t.

At first, my journal was basic. Entry. Stop. Target. Result. It was useful, but shallow. It told me what happened, not why it happened.

The real shift came when I started writing how the trade felt.

Not emotions in a dramatic sense. Just simple observations. Rushed. Hesitant. Confident but distracted. Forcing it. Nothing profound on its own, but over time, patterns emerged.

I noticed something uncomfortable. Many of my worst trades looked fine technically. Structure was there. Levels made sense. On paper, they were valid.

My state wasn’t.

I was taking trades when I was bored. Or slightly annoyed. Or trying to make the session feel productive. None of that shows up on a chart.

The journal also revealed something unexpected. My best trades were quiet. No adrenaline. No urgency. Just execution. When a trade felt exciting, it was often because I was bending something without admitting it.

Over time, the journal became a mirror. Not of the market, but of me. It showed when I ignored my rules. When I sized up. When I traded after I should have stopped.

The chart never told me that story.

My best trades were quiet. No adrenaline. No urgency. Just execution.

One of the clearest lessons was this: most mistakes happen before the entry. In the mindset. In the intention. By the time I click buy or sell, the damage is often already done.

Now, some of my most important journal entries don’t include screenshots at all. They include sentences like trading to prove something, didn’t like the loss before this, should have stopped after the first win.

The journal taught me what no indicator ever could. That consistency isn’t about being right more often. It’s about recognising yourself in real time.

Charts are objective. They don’t lie. But they’re also incomplete.

The journal fills in the missing half. The human half.

If I could only keep one tool as a trader, it wouldn’t be a strategy or an indicator. It would be the journal.

The market keeps changing. My patterns repeat.