Tag Archive for: Consistency

Two traders take the same course. Same rules, same instrument, same hours at the screen. Six months later one is flat and the other is down 30%.

The easy conclusion is that the strategy failed for one of them. It didn’t. They were never running the same strategy. They were running the same document.

A written strategy is a set of instructions. An executed strategy is what actually happened at the desk. Nearly all of the difference lives in the gap between them, and most traders never look, because they only ever examine the document.

Here is what really differs, in rough order of damage.

Two traders splitting their trading hours differently but using the same strategy are testing different things, then comparing results as if they were one.

The signals you skip are a strategy decision

Any strategy worth following produces more valid signals than one person will take. You are asleep, at work, or unconvinced. So you filter. Everybody filters.

The question is what your filter selects for.

One trader takes the clean setups and passes on the marginal ones. The level is obvious, the entry sits where the plan says it should. Dull. Dull is the point.

The other passes on the clean ones because they look slow, and takes the marginal ones because something is happening. Faster candles. A level that nearly holds. A move already underway.

Neither has broken a rule. Both would say they follow the strategy. But hand their filled orders to a stranger and they would be read as two different methods. One is taking a subset with better than average characteristics. The other is taking a subset selected for excitement.

Selection is the largest single variable, and it is invisible, because nobody logs the trades they didn’t take.

Size changes who you are by week three

Same rules, different risk per trade. Two $50,000 accounts. One trader risks 1%, or $500. The other risks 3%, or $1,500.

Now run six losses in a row, which any honest strategy hands you eventually. The first trader is down about 5.9%. Uncomfortable. The second is down about 16.7%. That isn’t uncomfortable, that is a different emotional state.

And it feeds back. The trader down 16.7% hesitates on the next valid signal, or sizes up to make it back. By week three they are not the trader who wrote the rules. Their sizing has quietly rewritten their selection and their exits.

Risk per trade gets discussed as an arithmetic question. It is a psychology question wearing an arithmetic costume.

The same setup at a different hour is a different setup

Volatility, volume and who is in the market change through the day. A setup taken in the first thirty minutes of the US session and the same setup taken in a quiet midday drift share a shape and little else.

Two traders splitting their trading hours differently but using the same strategy are testing different things, then comparing results as if they were one.

Taking +1R when the plan says +3R

Say the strategy wins 40% of the time and targets +3R. Over a hundred trades: 40 wins at 3R, 60 losses at 1R. That is 120R less 60R: +60R, or +0.6R per trade.

Now exit early. You take +1R when the trade stalls and the screen gets uncomfortable. Your win rate rises, because more trades reach +1R than reach +3R. Say it rises to 55%. That is 55 wins at 1R against 45 losses at 1R: +10R over a hundred trades, or +0.10R each.

Same entries. Same losses. A sixth of the return.

To get back to +0.6R while exiting at +1R, that trader would need to win 80% of the time, and nothing about their entry produces 80%. They have moved themselves to a point on the win rate and risk-reward curve their method cannot support, one sensible-feeling decision at a time.

A strategy followed 80% of the time is a different strategy

Fifty trades is a sequence, not just a sample

Two people run the same positive expectancy strategy for fifty trades. Same edge. Different order.

At a 40% win rate, six losses in a row has a probability of about 4.7% from any given starting point, so across fifty trades you should expect one. Whether it lands at trades 1 to 6 or trades 31 to 36 is luck.

The one who meets it first rarely reaches trade fifty. They adjust something at trade nine, and again at trade seventeen. By trade fifty they have run four strategies for twelve trades each and learnt nothing dependable about any of them.

A strategy followed 80% of the time is a different strategy

The 20% you deviate on is not a rounding error. It is a second, unnamed strategy with unknown properties, and its trades sit in the same account, so your results describe a blend you have never written down and cannot test.

None of this is a story about discipline as a personality trait. Some people are steadier than others, but that is not the useful part. The gap between the written strategy and the executed one can be measured, and measuring it doesn’t need a change of character. It needs a record.

What to log for the next two weeks

Every valid signal the strategy produced. Not just the ones you took.

Four fields for each:

  • Taken or skipped
  • If skipped, the reason, written at the time
  • Session and time of day
  • Risk taken, and where you exited versus the plan

By the end you will have two strategies on paper: the one in your Playbook, and the one you ran. Read the skip reasons together and the filter you didn’t know you had becomes obvious. Read the exits together and you will see your real risk-reward.

That log is the difference between the two traders, written down.

Most study time goes on the smaller half of the problem. Another confirmation tool, a tighter entry, a different instrument. The executed version, the one with the skipped signals and the early exits, is the version you are being paid or charged for.

Write both down. Then you can compare them.
The number that feels like progress

You can win seven trades out of ten and still watch your account shrink.

It sounds wrong the first time you hear it. Win rate is the first number most new traders reach for, because it feels like a school grade. 70% sounds like a pass. 40% sounds like failure.

I spent my early months chasing that number. I wanted a strategy that was right more often than it was wrong, because being right felt like progress. The problem is that being right and making money are not the same thing. They are not even close.

Win rate is only half a sentence

A win rate on its own tells you how often you win. It says nothing about how much you win when you are right, or how much you lose when you are wrong. That second half is where your account is actually decided.

Here is the maths, kept simple. Say you win 70% of your trades, but your winners are small and your losers are large. You bank +0.5R on a win and give back -1R on a loss. Over ten trades, that is seven wins at +0.5R (+3.5R) and three losses at -1R (-3R). Net result: +0.5R across ten trades. A 70% win rate, and you have made almost nothing.

Now flip it. Say you win only 40% of your trades, but you let your winners run to +3R and cut your losers at -1R. Four wins at +3R (+12R) and six losses at -1R (-6R). Net result: +6R across ten trades, from a strategy that is wrong more often than it is right.

The trader who loses more often makes twelve times as much. Win rate did not tell you that. It could not.

The number that actually pays

The figure that matters is expectancy: what you can expect to make, on average, per trade. You work it out from both halves of the sentence.

Expectancy = (win rate x average win) – (loss rate x average loss)

Run the second example through it: (0.4 x 3) – (0.6 x 1) = 1.2 – 0.6 = +0.6R per trade. That is the number to know. It says that every time you place a trade to your plan, you can expect to make six tenths of your risk back, on average, over a large enough sample. Positive expectancy with enough repetitions is the whole game. Everything else is decoration.

This is why I stopped celebrating individual wins and stopped flinching at individual losses. A single trade tells me nothing. The average over a hundred trades tells me everything.

A single trade tells me nothing. The average over a hundred trades tells me everything.

What I track instead

Once you accept that expectancy is the destination, the day-to-day metrics change. These are the ones I keep in my journal now.

Average R per win and average R per loss, tracked separately. If my average loss is creeping above -1R, I am cutting too late, and no win rate will save me.

Expectancy per trade, in R, calculated across a rolling sample rather than a single day. One bad session does not move it much, which is the point.

Sample size. A positive expectancy over twelve trades is noise. Over a hundred and twenty, it is a signal. I do not trust any of my own numbers until the sample is big enough to mean something.

Process adherence, the one that is not about money. For every trade I log whether it was an A+ setup that met my filters, or whether I forced it. A profitable trade that broke my rules is still a bad trade. It just got lucky, and luck is not repeatable.

If you run the STRATEGY indicator, some of this is done for you. It has a stats panel that surfaces win rate, average RR and expectancy as you go, so you are not working the maths out by hand on a Sunday evening. The numbers matter more than where they come from, but having all three in front of you at once makes it harder to fixate on win rate and ignore the half of the sentence you would rather not look at.

Once you accept that expectancy is the destination, the day-to-day metrics change.

Why this is calmer, not just smarter

There is a quieter benefit to this. When your scorecard is win rate, every single loss feels like a mark against you, and you start trading to protect the number. You take profit early to lock in a win. You move your stop to avoid being wrong. Both habits shrink your average win and grow your average loss, which is exactly how a high win rate ends up with a flat account.

When your scorecard is expectancy and process, a loss inside your rules is not a failure. It is one of the six trades out of ten that you already knew would not work, paid for by the four that do. You stop needing to be right. You just need to be consistent.Once you accept that expectancy is the destination, the day-to-day metrics change.

Win rate is not useless. It is one input into expectancy, and a strategy with a dreadful win rate is hard to sit through even when the maths works. But on its own, as a measure of whether you are getting better, it is close to meaningless. Track the full sentence, not half of it.

You told them you were a trader

It usually slips out somewhere ordinary. A dinner, a group chat, a catch-up with someone you have not seen in a while. They ask what you have been up to, and you say it: you have got into trading. Maybe you dress it up as a side thing, maybe you do not. Either way, it is out now.

And it felt good to say. It sounded like you were building something, taking control, doing the kind of thing most people only talk about. The problem is that the words went out long before the results did. You claimed the identity on credit.

From that moment, every trade has an audience. Not a real one, mostly. An imagined one, made of the people you told, sitting quietly in the back of your head, waiting to see whether the thing you announced actually works.

An audience raises the stakes on outcomes you were already struggling to hold loosely.

What the audience does to your decisions

An audience raises the stakes on outcomes you were already struggling to hold loosely.

A losing trade is just a losing trade until other people know you trade. Then it becomes a small piece of evidence that you might have been wrong about yourself, in front of everyone who heard you say it. That is a heavier thing to carry into the next click. You start needing trades to work, not just wanting them to, and needing a trade to work is one of the most reliable ways to trade badly.

It shows up as trades you take to have something to report. It shows up as a loss you will not close because closing it makes the story you told feel false. It shows up as the itch, after a family member half-jokingly asks how the trading is going, to go and prove them right with a session that gets the number back. None of that is coming from the chart. All of it is coming from the audience you invited in.

The account cannot tell the difference between a trade you took because it was there and a trade you took because you had told your brother-in-law you were a trader. But your equity curve feels the second kind eventually.

Trading in public before you are ready

There is a version of this that goes further. Posting the wins. Sharing the screenshots. Letting people watch.

It is tempting because it feels like accountability, and because attention is pleasant. But doing it before your process is solid does something specific and unhelpful: it ties your trading to how you look. Once an audience is watching in real time, the pull to keep up appearances competes directly with the pull to follow your plan. You take the trade that makes a good post instead of the trade that makes sense. You avoid logging the loss because the loss is now public. You are performing being a trader instead of learning to be one, and those two jobs pull in opposite directions.

The early phase of this is quiet, unglamorous, and full of mistakes you would rather nobody saw. That is exactly as it should be. Learning in the open is a fine thing once you have something honest to show. Doing it before then just adds a spotlight to the part of the journey that most needs privacy.

A losing trade is just a losing trade until other people know you trade.

Why silence protects the process

Keeping it to yourself is not about secrecy or shame. It is about protecting a fragile process from pressure it does not need yet.

When nobody knows, a loss is just information. You log it, you learn from it, you move on, and the only person who has to make peace with it is you. When nobody knows, you can change your approach, take a month off, size down to almost nothing while you rebuild, without explaining any of it to anyone. You keep the freedom to be a beginner, which is the freedom to get things wrong cheaply.

There is a difference between “I am a trader” and “I am learning to trade.” The first is a claim about results. The second is a description of the work. Early on, the second one is both more accurate and less costly to hold. It does not put anything on the line that a normal losing streak can threaten.

What to do with the urge to say it

The urge to tell people is really an urge to feel like the thing is real before it is. That is understandable, and it is worth resisting for a while longer than feels comfortable.

Let the results arrive first. Let there be a track record, a stretch of consistency, an actual body of work behind the word before you hand the word to anyone. When it is backed by something, saying it costs you nothing, because a bad week can no longer make you a liar.

Until then, the quiet is doing you a favour. It keeps the audience out of your decisions and leaves you alone with the chart, the plan, and the slow, unwitnessed work of getting good. That is the only place the results were ever going to come from anyway.

The day was green, so you felt like a good person

You closed the platform up on the day and something in your chest loosened. You were kinder at dinner. You slept well. You felt, quietly, like you had earned your place.

Then a red day arrived, and the whole thing inverted. Short with your family. Replaying the trades in the shower. A low, familiar feeling that you are not cut out for this, that everyone else has figured out something you never will.

If that swing sounds familiar, the problem is not really your trading. It is that you have made the P&L a verdict on you as a person. A green day says you are competent, disciplined, worth something. A red day says the opposite. And once that link is in place, every session is quietly loaded with far more than money.

When your self-worth is riding on that daily number, you are pinning how you feel about yourself to something close to a coin flip.

What you have actually done

You have taken a number that is mostly outside your control on any given day and turned it into a scoreboard for your character.

This matters because trading outcomes are noisy. You can follow your plan perfectly and lose. You can break every rule you have and win. Over a large enough sample the process shows up in the results, but on any single day the connection between “did I trade well” and “did I make money” is loose at best. When your self-worth is riding on that daily number, you are pinning how you feel about yourself to something close to a coin flip.

So you end up feeling like a failure on days you traded well and lost, and feeling great on days you got lucky doing something stupid. Neither of those feelings is telling you the truth. Both of them are teaching you the wrong lesson.

How it leaks into the trading itself

Here is the part that actually damages the account.

When a green day means you are a good person, you start protecting the feeling instead of the process. You bank a winner far too early because you cannot bear to hand back the gain that is currently making you feel worthy. You refuse to take a valid loss because closing red feels like admitting something about yourself. You trade to defend an identity, not to follow a plan.

And after a red day, the need to fix the feeling takes over. You come back the next morning not to trade your setups but to get the number green again, because green is where you feel okay. That is where revenge trading is born. Not from greed, but from a person trying to feel like themselves again.

The moment your identity is on the line in every trade, you cannot make calm decisions. Nobody can. The stake is too high, and it is the wrong stake.

Separate the two things that got tangled

You are not your equity curve. The account measures the outcome of your decisions across changing conditions, luck included. It does not measure whether you are disciplined, intelligent, or worth respecting.

The thing worth being proud of is the process. Did you wait for your setup? Did you size it properly? Did you take the loss where you said you would? Did you leave when you had done enough? Those are the things you control, and those are the things that actually predict whether you make it. Judge yourself on those, and a losing day where you did everything right becomes what it actually is: a good day.

This is not a mindset trick to feel better about losses. It is a more accurate way of keeping score. A trader who follows the plan and loses has done their job. A trader who abandons the plan and wins has not. If your internal scoreboard cannot tell those two apart, it is measuring the wrong thing.

A trader who follows the plan and loses has done their job. A trader who abandons the plan and wins has not.

What this looks like in practice

At the end of the session, ask a different question first. Not “how much did I make,” but “did I trade the way I said I would.” Grade the process before you look at the number. Some days those two answers will disagree, and learning to sit with that gap is most of the work.

Keep the numbers in the journal, where they belong, over a sample long enough to mean something. A single day tells you almost nothing about you. A month of process notes tells you plenty.

And notice the mood swing when it happens. The evening you feel quietly superior because the day was green is the same evening you are one bad session away from feeling worthless. Both of those are the same mistake wearing different clothes. The goal is not to feel great on green days. It is to feel roughly the same on both, because your worth was never the thing being traded.

At the end of the session, ask a different question first. Not “how much did I make,” but “did I trade the way I said I would.”

The account will do what it does. Some days green, some days red, hopefully drifting up over time. You get to be the same person through all of it. That steadiness is not a nice-to-have. It is the thing that lets you keep showing up long enough for the process to pay.

Most blown accounts don’t die from a single dramatic loss. They die quietly, from one bad habit repeated until the balance runs out.

The frustrating part is that none of these habits feel like mistakes in the moment. They feel like instinct. They feel like you’re doing something. And that is exactly why they’re so hard to spot in yourself.

So here are the worst of them. Some are genuinely expensive. Some are just a bit silly. I’ve been guilty of most, which is the only reason I can describe them so precisely.

Revenge trading: the most expensive way to feel better

You take a loss. It stings. Instead of closing the laptop, you immediately look for the next trade to win it back.

This is the big one. Revenge trading is what turns a bad trade into a bad day, and a bad day into a bad week.

The logic feels airtight at the time. The market took something from you, so you’re going to take it back. But the market doesn’t know you exist, and it certainly doesn’t owe you a refund. What actually happens is you trade bigger, with less patience, on a worse setup, while your judgement is at its lowest point of the day.

The fix isn’t complicated. It’s just hard. After a loss that gets under your skin, you stop. Not “stop after one more.” Stop.

Collecting indicators like they’re going out of fashion

Here’s the stereotype, and you’ve met him. The chart so crowded with indicators it looks like air traffic control. Three moving averages, two oscillators, a cloud, volume profile, and something with a German name you found on a forum at 2am.

You’re not reading the market. You’re waiting for all eleven things to agree, which they never do, because half of them are measuring the same price action in slightly different colours.

More inputs don’t make a clearer decision. They just make more noise. The trader who watches structure and one or two clean levels usually sees more than the one drowning in confluence. A chart should help you think, not hide the thinking.

The trader who watches structure and one or two clean levels usually sees more than the one drowning in confluence.

Moving the stop loss because “it’ll come back”

You set a stop. Price moves towards it. And right before it hits, you drag it a little further away. Just to give the trade room.

It usually does come back, the first few times. That’s the trap. The market teaches you the worst possible lesson by occasionally rewarding the worst possible behaviour.

Then one day it doesn’t come back, and the loss you’ve been avoiding arrives all at once, several times larger than the one you originally agreed to take. A stop loss you move isn’t a stop loss. It’s a suggestion you make to yourself and then ignore.

The whole point of deciding your risk before the trade is that the version of you placing the trade is calmer than the version of you watching it go wrong.

Only ever posting the wins

This one is more of a culture problem than a personal one, but it shapes how everybody else behaves.

Scroll through any trading feed and you’ll see an unbroken stream of green. +400%. Account up. Another clean win. Funny how nobody seems to post the day they blew up and gave it all back.

The selective screenshot is the dishonest heart of trading culture. It sells a version of the job that doesn’t exist, where every entry is a winner and the equity curve only points one way. New traders see it, assume that’s normal, and then quietly panic when their own results look like real results, which is to say lumpy, occasionally red, and slow.

I’d rather see someone’s losing month than their best ever day. The losing month tells me how they handle the part of trading that actually decides whether they last.

Funny how nobody seems to post the day they blew up and gave it all back.

Trading without a journal, then wondering what went wrong

If you don’t write down what you did, you can’t learn from it. You can only remember it, and memory is a generous liar.

Ask a trader without a journal why they lost last week and you’ll get a feeling, not an answer. “I think I was overtrading.” Maybe. Or maybe you took the same B-grade setup eleven times and it lost eight, and you’d know that for certain if it were written down.

A journal turns vague guilt into specific evidence. It’s the difference between “I need to be more disciplined” and “I lose money every time I trade the first ten minutes of the session, so I’ll stop doing that.” One is a New Year’s resolution. The other is a rule.

It doesn’t need to be fancy. A notebook and an honest sentence about each trade beats a spreadsheet you never open.

The habit underneath all the habits

Look closely and most of these share a root. They’re all ways of avoiding a small, uncomfortable thing now, in exchange for a larger, worse thing later. Skip the loss, skip the discipline, skip the honest record, skip the boredom etc

Good trading is mostly the willingness to be a bit bored and a bit uncomfortable on purpose. Not careless or reckless, but controlled. The best habits aren’t exciting. They’re just the unglamorous things, done again and again, on the days you don’t feel like it.

The best habits aren’t exciting. They’re just the unglamorous things, done again and again

That’s the whole job, really. Spot the habit, name it honestly, and replace it with something duller and better.

You close the platform, glance at the day’s P&L, and it’s red. Not a blow-up day, just red. The annoying part is you didn’t trade badly. You actually had more wins than losses. You followed the plan. On paper it was a good day.  So what gives?

So why did your account go backwards?

I’ve had days exactly like that. The trades were fine. The sizing wasn’t.

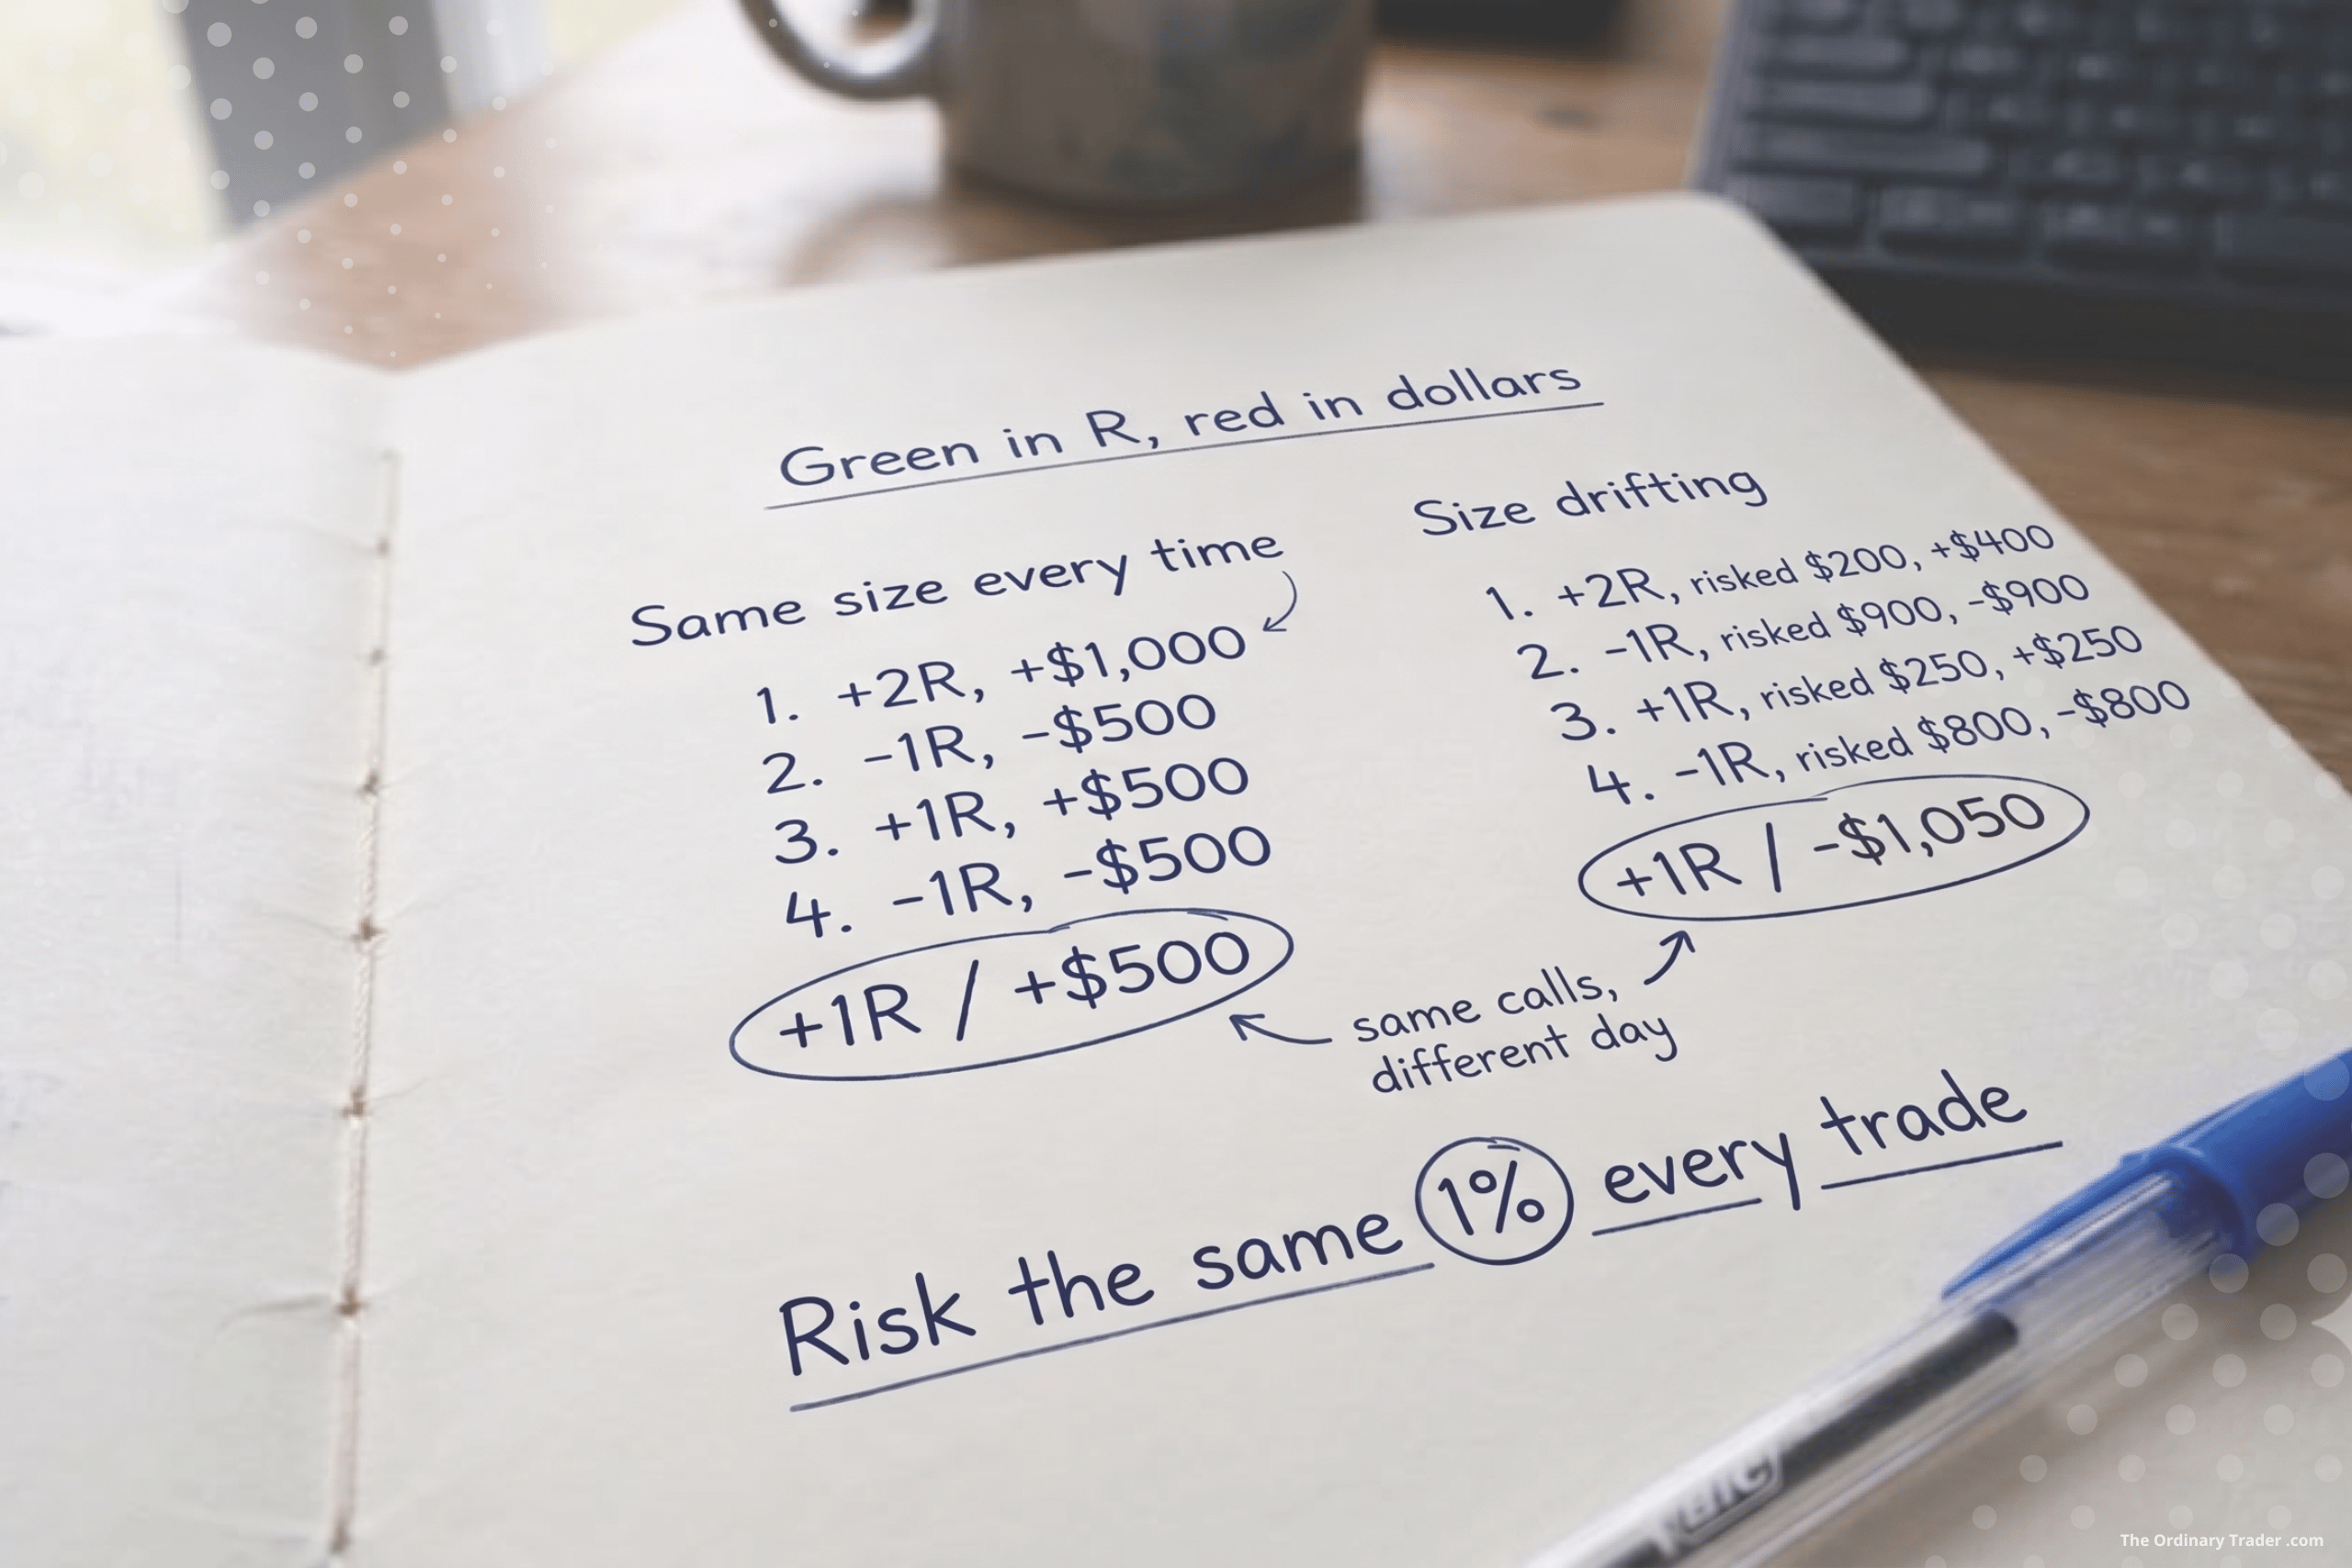
This is the gap between a green day in R and a red day in dollars. It catches a lot of traders out, and once you’ve seen it you can’t unsee it.

R measures your decisions. Dollars measure your consistency. You can read the market well all day and still finish red if your sizing is all over the place.

Thinking in R, not just dollars

Quick definition first. R is just the amount you risk on a single trade. Risk $500 on a position and that $500 is your 1R. A trade that pays twice your risk is +2R. A full loss is -1R. R lets you talk about trades without the account size getting in the way, so a +2R win is a +2R win whether you’re trading $5,000 or $500,000.

Counting your day in R tells you one thing: whether your decisions were any good. Add up the R across every trade, and a positive number means the market paid you for the calls you made.

Dollars tell you something else. They tell you whether your sizing matched those decisions.

Most days the two agree. A green day in R is a green day in dollars. But they only stay in step if every R is worth about the same number of dollars. The moment your sizing drifts, they come apart.

Same trades, two different days

Here’s a simple example. Account of $50,000, risking 1% per trade, so 1R is $500. Four trades on the day.

Sized the same every time, at $500:

  • Trade 1: win, +2R, +$1,000
  • Trade 2: loss, -1R, -$500
  • Trade 3: win, +1R, +$500
  • Trade 4: loss, -1R, -$500

Net R: +1R. Net dollars: +$500. Green in both. Nothing clever happened. The sizing was just consistent.

Now the same four trades, the same R outcomes, but the sizing wandered. The wins landed on setups I was unsure about, so I went in small. The losses landed on the ones that looked obvious, so I went in heavy.

  • Trade 1: win, +2R, risked $200, +$400
  • Trade 2: loss, -1R, risked $900, -$900
  • Trade 3: win, +1R, risked $250, +$250
  • Trade 4: loss, -1R, risked $800, -$800

Net R: still +1R. The decisions were identical. Net dollars: -$1,050.

Red.

Same trades. Same calls. One day green, one day red. The only thing that changed was how much sat on the line each time.

Why sizing drifts without you noticing

That second day isn’t a freak event. It’s the pattern most of us fall into the moment we stop sizing by rule.

The setups that feel obvious tempt you to size up. They look like free money, so why not press? The trouble is the market doesn’t know which of your trades felt obvious. Some of those sure things lose, and now your biggest position is also your biggest loss.

The setups you’re unsure about tempt you to size down. Then it runs clean to target and you’ve collected a fraction of what the call was worth.

Yesterday leaks in too. After a win, confidence is up and the next position quietly creeps larger. I had this on a crude oil trade not long ago. An early win in the session made it far too easy to assume the next long would behave the same way. After a loss, the opposite happens and you shrink.

None of this is a decision you make on purpose. That’s what makes it dangerous. The R stays honest. The dollars quietly betray you.

Risk the same amount every time

The fix is boring, which is rather the point.

Risk the same percentage on every trade. I aim for 1% of my balance, every time, no matter how good the setup looks. The whole idea of an edge is that you’re right more often than you’re wrong across a large number of trades. You don’t know in advance which individual trade will be the winner. So betting more on the ones that feel good is just guessing, dressed up as conviction.

Fix the percentage and the dollars line up with the R. A green day in R becomes a green day in dollars, because that’s how the maths works when every R is the same size.

When one contract is too much

There’s a practical snag. Futures contracts come in fixed sizes, and sometimes one contract already risks more than 1%.

Take crude oil. One standard contract (CL) moves $10 a tick. The micro version (MCL) is a tenth of that, $1 a tick. Say your stop is 20 ticks and your 1% is $500.

With the standard contract, one CL risks $200 over that stop. To hit $500 you’d need 2.5 contracts, and you can’t trade half a contract. So you round to two ($400, or 0.8%) or three ($600, or 1.2%). Either way you’ve missed your number.

With micros, one MCL risks $20 over the same stop. $500 divided by $20 is exactly 25 micros. You land on 1% precisely.

That’s the case for dropping down to micros. Not because they’re safer, but because they let you size accurately when the bigger contract is too blunt an instrument. Most index futures work the same way, with a full contract and a micro at a tenth of the size.

Let the journal catch it

You log every session anyway. Add one column. Track the R and the dollars side by side, day by day.

Most days they’ll agree. The day you want to notice is the one where the R is green and the dollars are red. One of those is noise. A run of them is a message, and the message is that your sizing is the leak, not your strategy.

That matters because the instinct when the account bleeds is to go hunting for a better setup. But if the R is positive, the setups are doing their job. The thing to audit is how much you put on each one.

A note for funded traders

If you’re trading a prop firm evaluation, this stops being just an annoyance. A lot of firms run consistency rules, a cap on how much any single day or trade can contribute to your total profit. Size all over the place and one oversized winner can breach that limit, failing the challenge even on a profitable run. Same fix as always. Risk the same amount every time.

The quiet discipline

R measures your decisions. Dollars measure your consistency. You can read the market well all day and still finish red if your sizing is all over the place.

Sizing isn’t the exciting part of trading. It’s not a setup or an entry. It’s the bit that runs underneath, deciding whether your good decisions actually show up in the account. Get it consistent and the green days in R start turning into green days in dollars, which is the only place the difference ever really shows.

Some weeks are easy to explain. This wasn’t one of them.

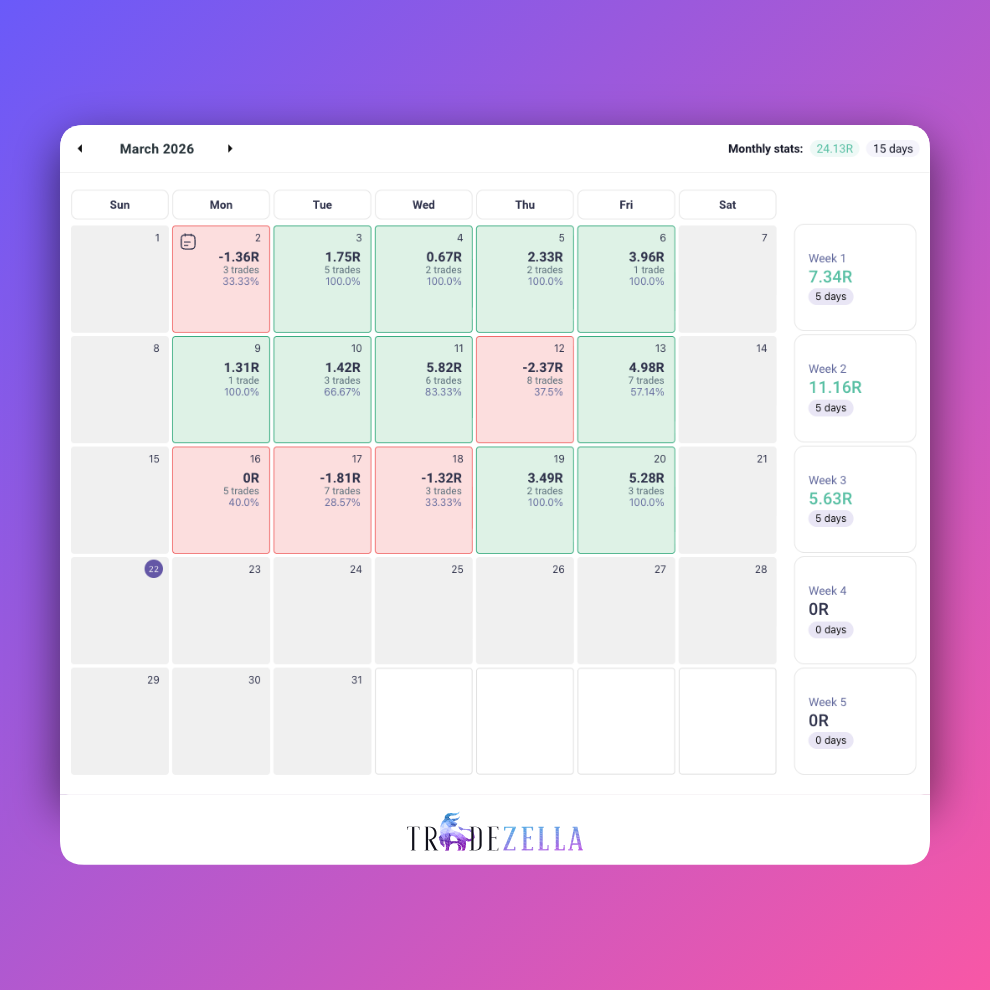
Week 12 split itself into two very different halves. Same markets, same approach, but completely different outcomes. Early on, it felt like nothing was really working. By the end, things had settled, and the week closed green. Not dramatically, just quietly solid.

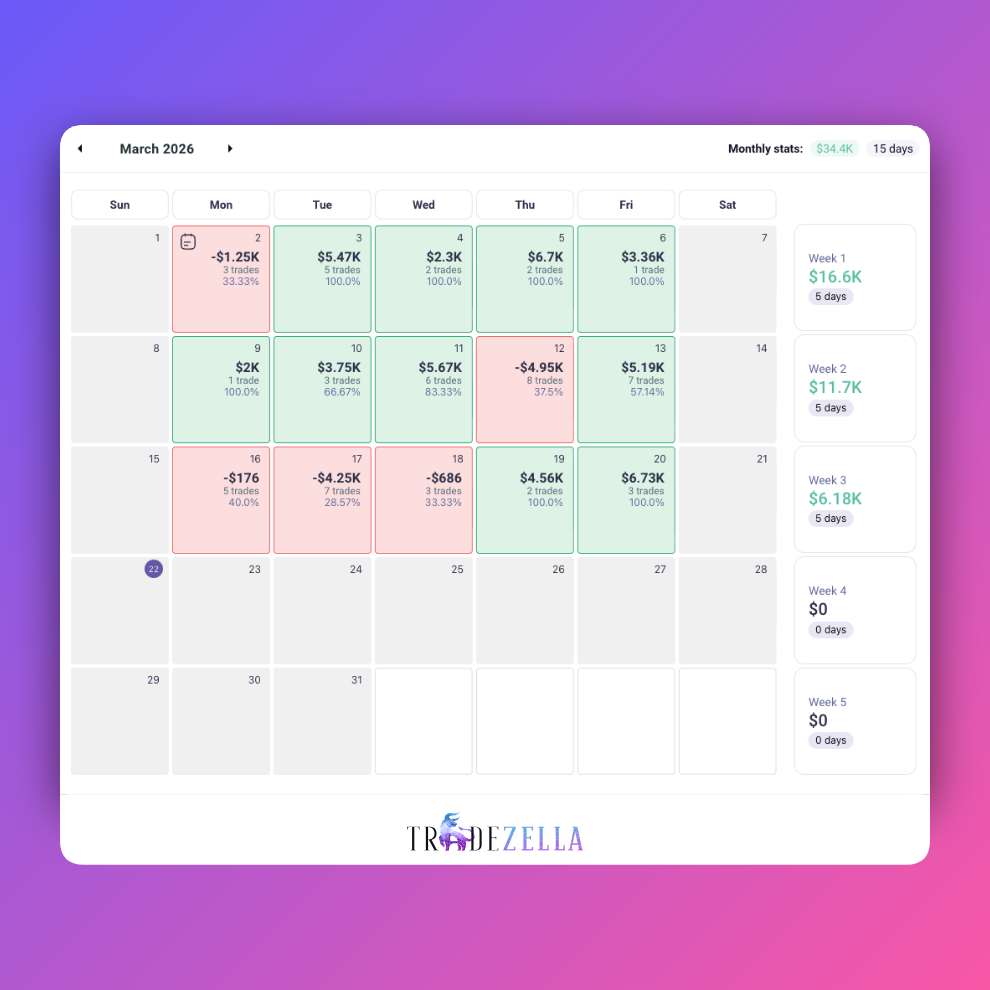
Looking at the numbers, Monday finished flat at 0R across five trades. Tuesday and Wednesday followed with controlled losses of -1.81R and -1.32R. Then the shift came. Thursday returned +3.49R from two trades, and Friday added +5.28R from three trades. Net result, a green week, but that doesn’t quite capture how it felt midweek.

A Flat Start That Wasn’t Really Flat

Monday is a good place to start because it highlights something that’s been showing up more often. It was a flat day on paper, but not in reality. There was a solid unrealised gain early in the session that slowly got given back. Not through one mistake, just a gradual erosion.

That raises a useful question. Am I managing downside better than upside?

Right now, it looks like the answer is yes. Losses are controlled. Risk is respected. There’s no sense of things getting out of hand. But locking in gains, especially when they’re there early, is still inconsistent. Both sides matter, and at the moment they’re developing at slightly different speeds.

Midweek Pressure, Controlled but Not Comfortable

Midweek is where things got uncomfortable, but also where some real progress showed up. Three red days in a row if you include Monday’s flat result. Confidence dipped a bit, especially trading metals, which felt slightly out of sync. Entries would trigger, but follow through wasn’t there, and moves stalled just before they should extend.

It’s a frustrating environment. Not chaotic, just enough friction to wear you down.

The important part is what didn’t happen. There was no revenge trading, no increase in size, and no deviation from the plan. Losses were capped under 2R each day, consistently. That’s not luck, that’s structure holding up under pressure. It might not feel like a win in the moment, but it is. It’s what keeps a rough patch from turning into a damaging week.

Then Something Shifted

The second half of the week felt different, but not in a dramatic way. Trade frequency dropped, execution felt cleaner, and outcomes improved.

Thursday delivered +3.49R from two trades, and Friday followed with +5.28R from three. A five trade win streak closed things out. Fewer trades, better outcomes. That combination usually points to something subtle improving rather than anything major changing.

The Goldilocks Problem

If there’s one idea that stands out from this week, it’s this. Not all zones are worth trading, even if they look valid.

Earlier in the week, there was a tendency to engage with tighter zones. They looked clean and precise, but didn’t carry much weight in live conditions. Price would interact, but not respect them in a meaningful way, which led to getting tagged in and then chopped out.

Later in the week, the focus shifted toward more balanced zones. Areas with enough structure to matter, but also enough space for the trade to develop properly. Not too tight, not too broad. That change alone reduced the need to take marginal setups and improved follow through on the trades that were taken.

You can see it reflected in activity as well. Early in the week there were 5, 7, and 3 trades per day. Later, that dropped to 2 and 3. Less activity, better outcomes. That’s usually a sign that selection is improving.

The Quiet Win (That Doesn’t Show in R)

It would be easy to point to the green PnL as the highlight of the week. It wasn’t.

The real win was getting through three difficult days without any emotional escalation. No spiral, no urgency to recover losses, no shift into reactive trading.

That wasn’t always the case, and it’s the kind of progress that doesn’t show up in a results column but shows up everywhere else over time.

So What Actually Improved

Not the strategy. Not the market. Just execution.

Better zone selection, less overtrading, and continued discipline around risk. Profit protection still needs work, especially on days where gains are there early, but the foundation feels stronger.

Final Thought

Progress doesn’t arrive cleanly. It shows up in fragments.

You improve one side, like loss control, while another still needs work, like protecting profits. You go through rough patches, then things start to click, not perfectly, but enough.

Week 12 wasn’t perfect, but it was honest. And more importantly, it felt like progress that can actually be repeated.

February wasn’t a headline month.
It was a character month.

On paper, the summary looks simple:

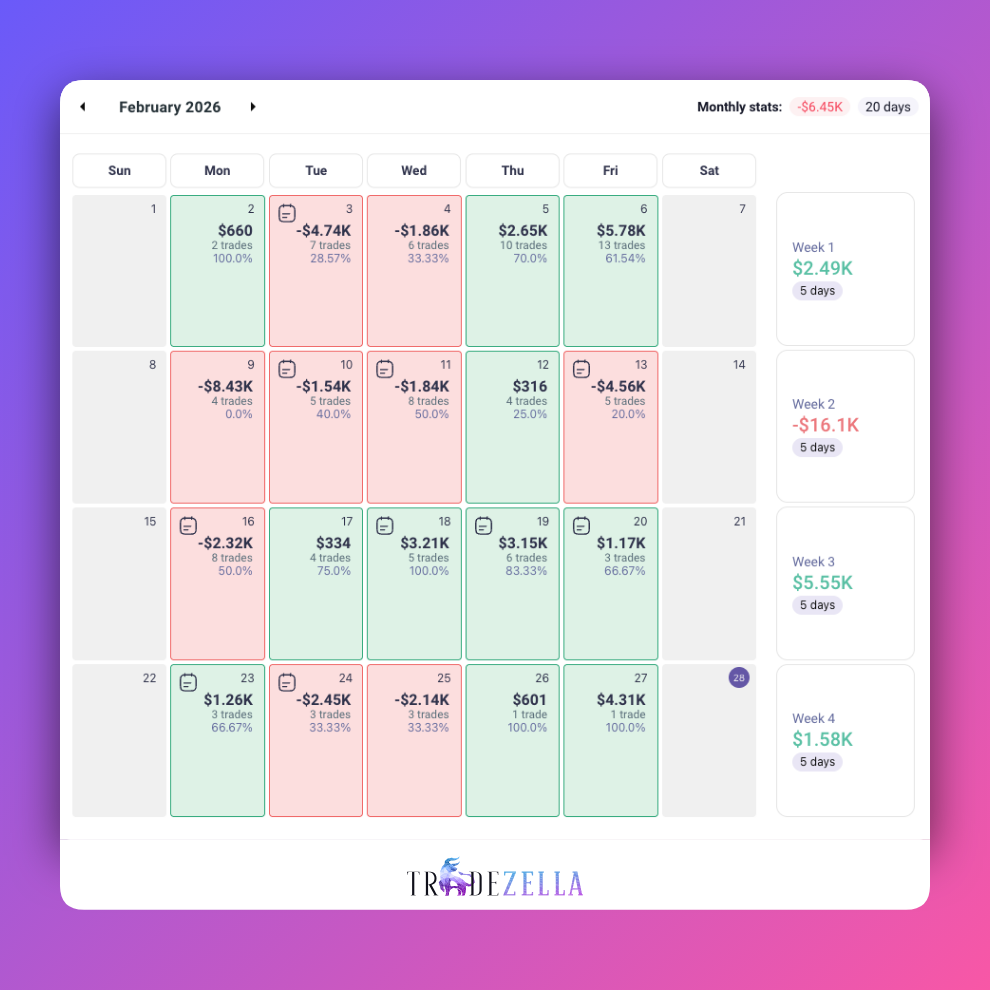
  • Monthly P&L: -$6.45K
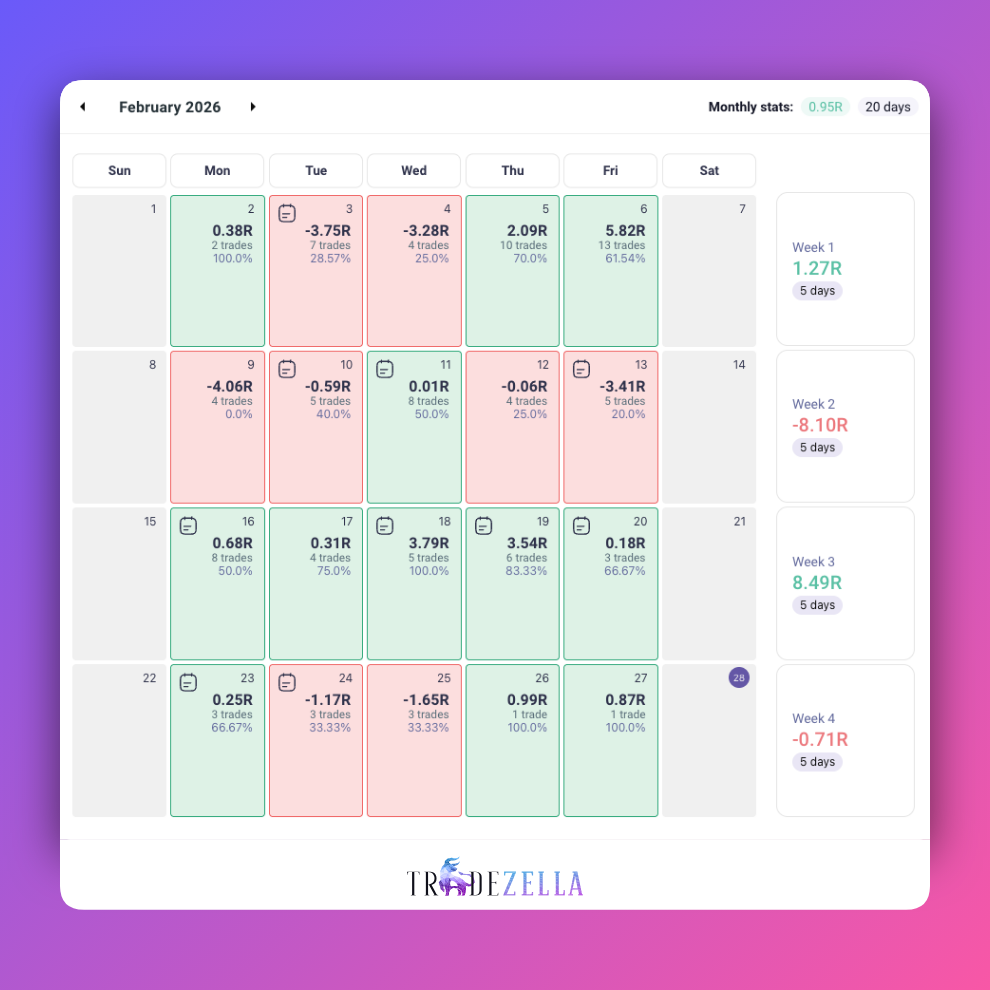
  • Monthly R: +0.95R
  • Trading days: 20
  • Green weeks: 3 out of 4
  • Red weeks: 1 significant (Week 2)

Depending on the lens you use, this month tells two different stories.

In dollars, it’s red.
In R, it’s slightly green.

That disconnect matters more than it first appears.

As I’ve written before, this project isn’t about performance theatre. It’s about documenting ordinary work done consistently over time . February fits that philosophy perfectly.


The Bigger Picture: When One Week Tries to Define the Month

Here’s the R breakdown:

  • Week 1: +1.27R
  • Week 2: -8.10R
  • Week 3: +8.49R
  • Week 4: -0.71R

Week 2 did the damage. A concentrated drawdown. No drama, but real impact.

Week 3, though, showed what happens when structure, patience, and selectivity align. +8.49R across five days isn’t noise. That’s execution.

Week 4? A “good loss.” -0.71R. Contained. Controlled. Boring, almost.

And boring is often good.

If you’ve followed the previous updates, you’ll recognise the theme. This wasn’t about chasing big weeks. It was about containment. When risk stayed defined, the account stabilised. When discipline slipped, losses clustered.

That’s not a revelation. It’s just reinforcement.

What Went Well (And Why It Matters)

1. Risk Containment Improved

There were red days. Several.

But very few spirals.

The guardrails held up better than earlier months:

  • Max 5 trades per day
  • Max 2R daily loss

February could have turned messy. It didn’t.

The -8R week stayed in its lane. It didn’t bleed into Weeks 3 and 4. That separation is growth. Not flashy growth. Structural growth.

And in trading, structural growth compounds faster than excitement ever will.

2. Recovery Without Revenge

Week 3 delivered +8.49R. That wasn’t emotional trading. It wasn’t trying to “get back” at the market.

It was alignment.

When conditions suited the strategy, execution was clean:

The recovery wasn’t dramatic. It was mechanical. Follow the plan. Let it work.

This is something I’ve talked about before — the idea that most mistakes don’t come from bad analysis, but from trying to improve a trade that’s already working . The same applies at the weekly level. Over-managing a drawdown often causes more damage than the drawdown itself.

3. Selective Days Were the Strongest Days

Some of the best sessions in February were single-trade days.

  • One trade. 100% win rate.
  • $4.31K on one position.
  • 0.99R, clean and simple.

That’s not volume. That’s precision.

There’s a quiet lesson here: more trades rarely equal more profit. In fact, the opposite is often true. The higher trade-count days were statistically weaker — lower win rates, more mid-range losses, less clarity.

Fewer trades. Better structure.

It keeps repeating for a reason.

What Needs Tightening Up

February wasn’t a setback. But it wasn’t flawless either.

1. Drawdown Clustering

Week 2 came in at -8.10R. Not catastrophic. But concentrated.

Looking at those losing days, the pattern is clear:

  • Mid-range losses between -1R and -4R
  • Win rates around 20–40%
  • Higher trade counts

Translation? Forcing flow in less optimal conditions.

It’s likely discretion crept in — over-trusting continuation without enough higher-timeframe confirmation. The setups weren’t terrible. They just weren’t strong enough to justify the frequency.

The solution isn’t complexity. It’s patience.

2. Dollar Volatility vs R Consistency

Here’s the uncomfortable part.

The month finished slightly positive in R but negative in dollars.

That suggests uneven sizing. Possibly scaling inconsistently on higher-conviction days. Or exposure spread across multiple accounts in a way that diluted R-to-dollar alignment.

For Project 1 Million, R is the anchor. R defines expectancy. Dollars follow.

But the gap is a reminder: structure first. Size second.

Scaling should reflect edge strength, not confidence level.

3. Neutral Days That Could Have Been Zero

There were a handful of small bleed days:

  • -0.59R
  • -0.06R
  • -1.17R
  • -1.65R

Individually small. Collectively meaningful.

The question is simple: did those sessions require participation?

Not every day needs action. Some days are better observed than traded. The discipline to sit out is often harder than the discipline to cut a loss.

And yet, it may be the more important skill.

Statistical Observations: What the Data Actually Says

Looking across the calendar, a few patterns stand out:

  • High win-rate days were often green — but not always large.
  • Some strong green days had moderate win rates, supported by solid R:R.
  • The worst days combined higher trade counts and lower win rates.
  • One strong week can offset a poor week — if risk stays stable.

Win rate alone is irrelevant.

Structure and R:R define survival.

That’s not new information. But it’s easy to forget when a week goes red.

The Honest Summary

February did not materially move Project 1 Million forward.

But it didn’t erode the structure either.

The account absorbed:

  • An -8R week
  • Multiple red days
  • Uneven market conditions

And still finished roughly flat in R.

That matters.

This is the middle phase. No hero months. No implosions. Just process under pressure.

And if the philosophy is to treat trading as ordinary work — done consistently, without hype or drama — then February fits.

No celebration. No panic. Just review.

Focus for March: Quiet Adjustments

March doesn’t require reinvention. It requires refinement.

The priorities are clear:

  • Protect against clustered drawdowns
  • Be willing not to trade
  • Scale only with clean higher-timeframe alignment
  • Continue prioritising structure over frequency

The goal isn’t explosive growth.

It’s asymmetry:

  • Small red
  • Contained flat
  • Occasional strong green

That’s how compounding works. Not through heroics. Through containment.

February was not impressive.

But it was controlled.

And sometimes, control is the most underrated edge in trading.

23rd – 27th February

Week 9 was a quieter week. Not dramatic. Not explosive. Just controlled.

Coming into it, the focus was very specific. I wanted to double down on discipline. That meant sticking to my trading planner rules without exception:

  • Maximum 5 trades per day
  • Maximum loss of 2R
  • Profit target of 2R
  • No deviation from 1 percent risk

In terms of execution, this was genuinely an A+ week. I followed the rules. I did not oversize. I did not chase. I did not break daily limits out of frustration or excitement. That might sound basic, but consistency in rule adherence is still the foundation of everything.

Now for the honest part.

The week closed slightly red at -0.71R.

There is no dressing that up. It was a losing week. But context matters. The loss was small. It was contained. It stayed well within predefined limits. That is what risk management is supposed to do.

If the model is working correctly, losing weeks will happen. The key is ensuring they are controlled, while winning weeks are allowed to expand.

If the model is working correctly, losing weeks will happen. The key is ensuring they are controlled, while winning weeks are allowed to expand. By that definition, this was what I would call a good loss.

What makes it more interesting is that I actually had more wins than losses. Six wins. Five losses. A 54.55 percent win rate.

Accuracy was not the issue.

The issue was upside. Many of the winning trades were under 1R. There were fewer runners. Without extended moves, the expectancy tightens quickly. When you cap downside effectively but fail to capture larger upside, the edge compresses.

That leads directly into the work I am doing behind the scenes.

Exit strategy testing continues. I am comparing different models, including fixed targets, partials, extended targets, and trailing approaches. Some early patterns are already emerging, but it is still too soon to draw firm conclusions.

Right now the objective is simple:

  • Log every trade consistently
  • Apply the same rules each session
  • Remove discretion from exits where possible
  • Build a meaningful sample size

Once I have tracked around 50-100 trades under consistent conditions, the data will start to speak clearly and I’m looking forward to sharing.

Week 9 was not about big numbers. It was about professional behaviour. The PnL was slightly red. The execution was green.

Over time, that combination is what compounds.

15th – 21st February

Week 8 felt different.

Not explosive.
Not dramatic.
Just steady.

After the turbulence of previous weeks, the focus coming into this one was simple: tighten execution, reduce noise, and behave like a professional.

The Plan

Going into the week, I set five clear rules:

  • Maximum 5 trades per day. Use the trade planner properly.

  • Only take true A+ zones.

  • Keep risk fixed at 1 percent. No oversizing. If resizing, it must be down, never up.

  • Validate structure on at least one timeframe higher before committing.

  • Reassess trailing stop placement relative to the timeframe of entry.

Nothing new. Nothing revolutionary.
Just better discipline.

The Reality

For the first time in a while, I felt genuine alignment between higher timeframe and lower timeframe structure.

Instead of marking up charts mechanically, I began to see how they overlapped.

A protected low on the higher timeframe could also serve as a shared protected low inside a lower timeframe zone. When those two lined up, the setup carried more weight. More confluence. More confidence.

That shift alone changed the quality of trades I was willing to take.

Fewer Trades, Better Decisions

I did not oversize once this week.

That matters more than it sounds.

Keeping risk fixed at 1 percent created emotional stability. There was no internal pressure to “make it back faster.” No temptation to lean heavier on volatile instruments.

Trade frequency also improved. I passed on many setups that I would have taken a few weeks ago. Patience is starting to feel less like restraint and more like strategy.

Ironically, I also identified multiple setups that went on to be great winners without me.

That is an important lesson.

There is a difference between patience and being too demanding on the pullback. If price does not retrace perfectly into your preferred level, sometimes the market simply moves without you. That is an area to refine moving forward. Not by lowering standards, but by avoiding greed in the entry refinement.

Performance Overview

In R terms, Week 8 closed +8.22R across 5 trading days.

In dollar terms, that translated to approximately +$5.18K.

After a difficult Week 7, that kind of rebound feels significant. Not because of the number itself, but because of how it was achieved.

  • No oversized positions

  • Reduced trade count

  • Better structural alignment

  • Cleaner execution

The process improved first. The results followed.

That is the order it should always be in.

Exit Strategy Experiments

One of the most valuable developments this week has been the start of structured exit testing.

I’ve begun comparing:

  • Fixed 1R

  • Partials

  • 1.5R targets

  • Full runners

  • Trailing scenarios

Instead of guessing, I’m running the data.

The goal is not to find the most exciting outcome.
It is to find the most consistent, repeatable one.

Over time, this testing should remove another layer of emotional decision making. Exits should be predefined, not improvised.

Bonus: A Milestone

Quietly, and slightly unbelievably, I passed three prop firm challenges this week.

Not one.
Not two.
Three.

Current funded capital now sits at $250K.

That is real progress.

It is easy to get distracted by daily PnL swings, but zooming out shows something else entirely. Structure is improving. Risk management is tightening. Emotional reactions are decreasing.

Funding is increasing.

The Bigger Picture

Week 8 was not about chasing big numbers.

It was about:

  • Respecting higher timeframe structure

  • Trusting confluence

  • Keeping risk consistent

  • Letting the edge play out

Ordinary discipline produced extraordinary stability.

And that is the direction this project needs to continue.

Trade well. Stay ordinary.