Your chart colours are making decisions for you
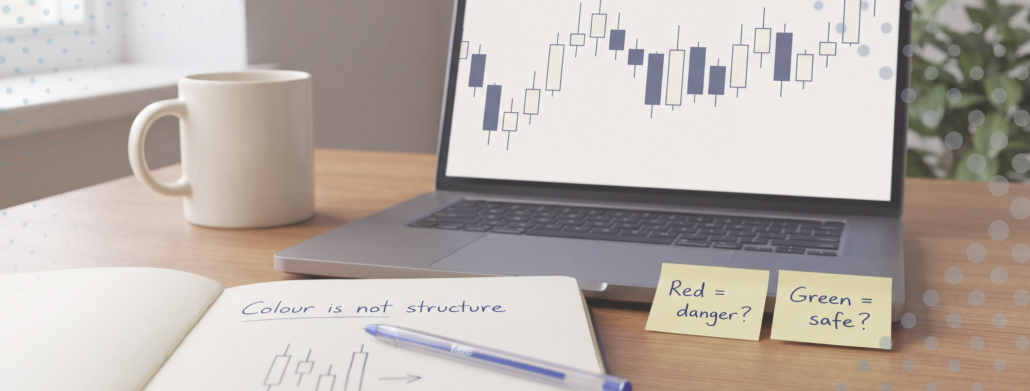
For years my charts ran the default TradingView green and red. I never thought about it. Green went up, red went down, and that was that.
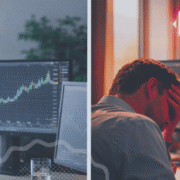
Then I changed them. Pale candles for up, a muted dark blue for down, on a light background. And I noticed something I didn’t expect: I was calmer. Not dramatically. Just less jumpy in the moments that used to get me, like a sharp push into a level I’d marked hours earlier.
It took me a while to work out why. The colours weren’t changing the chart. They were changing me.
Red isn’t neutral, and your brain knows it
Red is the colour of stop signs, warning lights and the corrections in a school exercise book. By the time any of us opened a trading platform, we’d had decades of conditioning that red means something has gone wrong.
That isn’t just a hunch. In a 2021 study published in Management Science, researchers Bazley, Cronqvist and Mormann ran eight experiments with more than 1,400 people. Showing the same financial data in red rather than black reduced people’s willingness to take risk by 15% to 30%. Red also seemed to stretch out pessimism. People who saw a falling stock in red expected it to keep falling, while those who saw the same numbers in black or blue were more likely to expect a reversal.
Two details stood out to me. The effect didn’t show up in colour-blind participants, and it was muted in China, where red signals prosperity. Blue and yellow didn’t produce it at all.
So it isn’t about the price. It’s about the paint.
The fast brain sees colour first
Here’s the part I find most useful. Colour registers before you consciously think about anything. Your eye takes in a wall of red candles a fraction of a second before your analytical mind gets around to asking where price actually is.
That gap matters. Think about the setups that test you most:
- A run of red candles into a demand zone you marked before the open. Structurally, that’s exactly what you were waiting for. Emotionally, it looks like danger.
- A steady stack of green candles into resistance. Structurally, that’s where you should be most careful. Emotionally, it looks safe.
In both cases the colour tells a story that runs against the structure. And because it arrives first, you’re arguing with a feeling before you’ve even started analysing. Most of the time you don’t notice the argument happening. You just notice you hesitated, or chased.
That’s the conscious versus unconscious split in practice. The plan lives in the slow, deliberate part of your mind. The colour talks to the fast part. Left alone, the fast part gets a vote it hasn’t earned.
Colour also decides where you look
Bias isn’t the only cost. Bright colour pulls attention. A saturated red candle, a neon indicator line, a flashing alert – your eyes go there whether it matters or not.
A chart with six indicators in six bright colours isn’t giving you more information. It’s giving you six things competing for the same small amount of focus. The level that actually matters, the one you drew calmly before the session, ends up as the quietest thing on the screen.
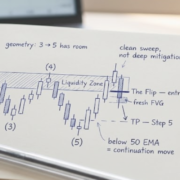
This is why I keep my charts deliberately boring. Muted candles. One or two EMAs. The zone and a couple of key levels. If something on the chart is loud, it should be loud because I decided it matters, not because that’s the default setting.
A simple experiment to try
You don’t have to take my word for any of this. Try it for a week.
- Go monochrome for one session. In TradingView’s chart settings, set the candle bodies, borders and wicks to two shades of one calm colour. Blue or grey both work. Trade or replay as normal.
- Notice the moments that feel different. Not the P&L. The feeling when price moves sharply against you, or runs towards your target. Jot it in your journal.
- If you want a harder lesson, flip it. Red for up, green for down, for one replay session only. It will feel wrong, and that feeling is useful. It shows how much the colours had been steering your read of the chart.
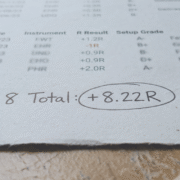
- Take the colour out of your P&L too. A red dollar figure in the corner of the screen is the most emotionally loaded thing on it. Hide it during the session, or track the trade in ticks or R instead. “Down 1R, still inside my plan” lands very differently from a red minus sign next to a dollar amount.
None of this changes your strategy. It changes the packaging around the information, so the information gets a fairer hearing.
A small change, not a fix
I want to be careful here. Changing your candle colours won’t make a bad plan profitable. It won’t stop you overtrading if you haven’t set your trade limits. If someone tells you a colour scheme is the missing piece, be suspicious.
What it does is remove one small source of noise between you and your process. Trading already asks a lot of your nervous system. There’s no reason to let the default settings add a layer of alarm on top.
The best sessions are quiet ones. It turns out the chart can be quiet too.
Trade well. Stay ordinary.