The STRATEGY indicator has two filters that both use EMAs to keep you trading with the trend, but they behave nothing alike. They serve very different purposes. That’s the part worth getting straight, because the shared “EMA” name does most of the confusing.
One checks where a Stage in the STRATEGY Sequence sits against a single moving average line. The other reads the broader, higher-timeframe trend from two moving averages and only reveals setups that align with the overall EMA direction. Both use EMAs as a building block, but they do completely different jobs.
Here’s what each one does, and when to reach for it.
(EMA is short for exponential moving average. It’s a line that follows price but gives more weight to recent candles, so it reacts faster than a plain average.)
LTF and HTF EMA’s working together
The EMA Filter: one level against one line
The EMA Filter asks a simple question. Where does a specific price level sit relative to a single EMA? If it’s on the wrong side, the setup gets thrown out.
You pick two things. A period (default 50) and a timeframe (default is whatever your chart is on). Then the Apply At setting decides which price level it checks, and at what point in the setup’s life:
- Sequence Creation: the Step 1 break level, when the sequence first forms.
- Liquidity: the Step 4 level, when liquidity confirms.
- Sequence Completion: the Step 5 sweep level, after the sweep.
- Flip Creation: the flip entry level, the moment the flip triggers.
For a bullish setup, that level has to be above the EMA. For a bearish one, below it.
Say you set Apply At to Flip Creation with the 50 EMA. You’re telling the indicator: only let me into a bullish trade if the flip pivot is above the 50 EMA at the moment it triggers. If it’s below, the setup gets discarded and labelled “EMA” on your chart, so you can see what it removed.
Two things people get wrong here.
First, it’s a one-time snapshot, not a running check. It looks once, at the stage you picked, and that’s it. If the setup passes and price later crosses back over the EMA, the setup stays valid. The filter has already done its job.
Second, “TF = Chart” does not mean the daily 50 EMA. It means whatever timeframe you’re looking at. On a 3 minute chart, it’s the 3 minute 50 EMA. If you want the daily as your reference, set the timeframe to D yourself.
One practical note to close this out. Flip Creation is the strictest option, because it checks right at entry. Sequence Creation is the loosest, because it checks early, before the setup has matured. That’s the trade-off. Filter harder and you cut more setups, including some that would have worked anyway.
The HTF Bias Filter: which way the bigger trend leans
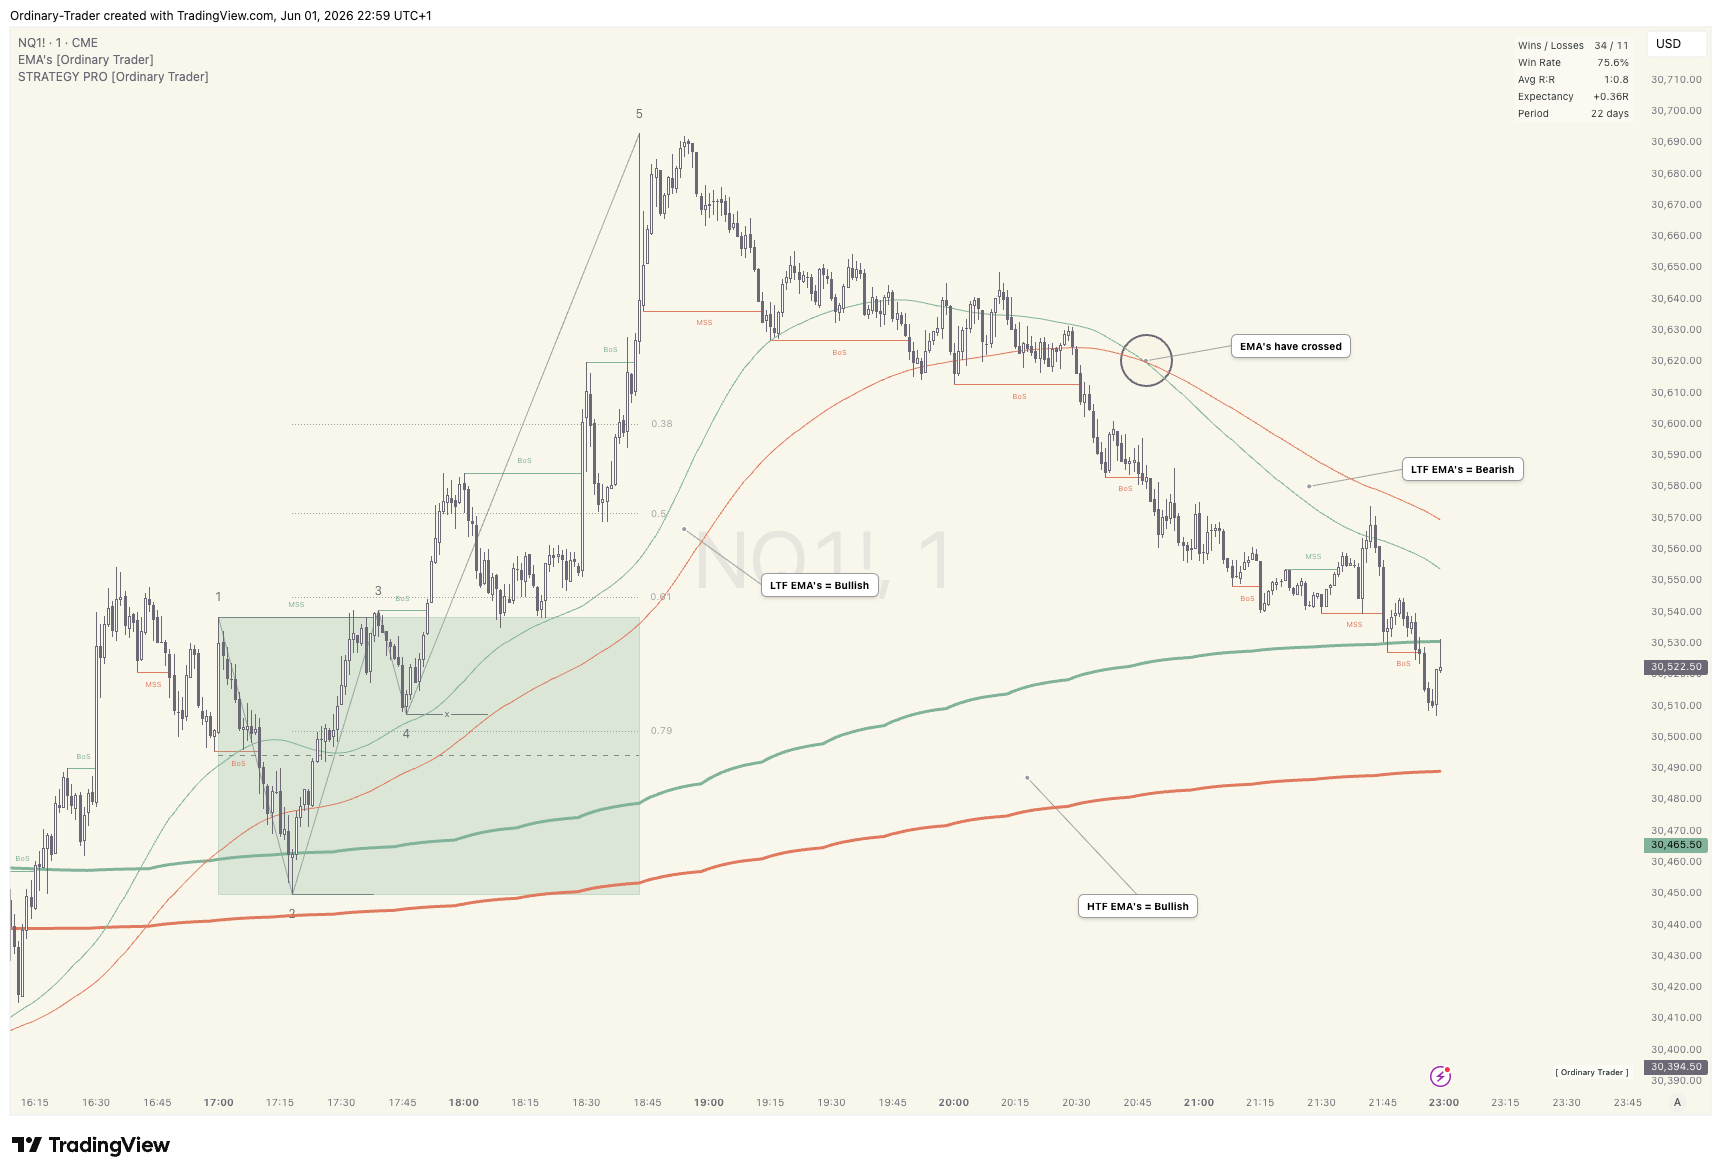
This one works differently. Instead of one price level against one EMA, it looks at two EMAs on a higher timeframe and only allows setups in the direction those two are pointing.
You pick a higher timeframe (I suggest 15 min), a fast EMA (default 50) and a slow EMA (default 100). The rule is plain. Fast above slow means the higher-timeframe bias is bullish, so only bullish setups are allowed. Fast below slow means it’s bearish, so only bearish setups are allowed.
With the defaults, the indicator only reveals bull setups when the daily 50 EMA sits above the daily 100 EMA. If the 50 is below the 100, no bull setups appear on your chart at all. Not even the clean ones. Every other condition can line up and you’ll still see nothing.
There’s no Apply At option here, and that’s on purpose. The higher-timeframe cross is a regime check. It’s about the broader trend, which only matters when a setup first forms. Once a sequence has cleared that gate, the bias can shift later without touching the trade.
The EMA pair is a dial you can turn. Tighter pairs like 20/50 flip bias more often, so more setups but more whipsaws. Wider pairs like 100/300 are steadier, fewer setups but cleaner trend regimes.
Same tool, two different questions
If you only remember one thing, make it this. The EMA Filter compares a price level to one EMA. The HTF Bias Filter compares two EMAs to each other. One judges where your entry sits. The other judges what kind of trend you’re in.
| EMA Filter | HTF Bias Filter | |
|---|---|---|
| What it compares | A price level vs one EMA | Two EMAs against each other |
| Timeframe | Chart or HTF (your choice) | Always HTF |
| When checked | Step 1, 4, 5 or Flip (your choice) | Always at sequence creation |
| Rejected setups | Visible, labelled “EMA” | Never appear at all |
| Best for | Filtering setups by entry location | Filtering by broader trend regime |
That difference in purpose is the thing to hold on to. One is a precision tool for a single setup. The other is a broad gate for the whole session. They answer different questions, so they’re not really alternatives. They’re a pair.
Can you run both at once?
Yes, and they pair well. The HTF Bias Filter gives you the broad regime, the kind of trend you’re trading inside. The EMA Filter then refines individual setups within that trend, checking where the entry sits against a closer moving average.
Turn both on and the filters stack. A setup has to clear the higher-timeframe regime check and the price-level check before it earns a place on your chart. Stricter, fewer setups, but every one that survives has passed both questions.
Which is the point of a filter in the first place. It isn’t there to give you more trades. It’s there to quietly remove the ones that don’t fit, before you ever have to decide.
Trade well. Stay ordinary.